TWO SIGNIFICANT THINGS HAPPENED LAST WEEK.
Written by: Robert and Russell Markham
Two significant things happened this week. Firstly, we went into a Confirmed Down (C/Dn) on 3rd June and the Reserve Bank of Australia lowered the Official Cash Rate to 1.25% to try and boost a flagging economy.
If you are following the Confirmed Call, the most conservative of all our Market Timing signals, VectorVest does not advocate buying stocks at this time and you should protect your existing positions. If you have set up a trading plan using tools like BackTester, then stick to your trading plan. One of the biggest mistakes you can make is not to stick to it!
Despite a C/Dn in place, we have some positive news. Interest rates are now at a historic low of 1.25%, which is an ingredient for a rising share market. In Chapter 3 of “Stocks, Strategies and Common Sense,” written by our founder Dr. Bart DiLiddo (you can find a link to this book on the Welcome tab), he writes:
“Stocks go up when:
1. Corporate earnings go up
2. Interested rates go down
3. Inflation rates go down.”
So where are we in terms of the 3 points above? Corporate earnings are rising and interest rates and inflation are falling.
Instead of having to do research for this information, VectorVest makes it very easy for you. Simply click on the Views tab and scroll to the Climate section (you can also use the dropdown menu just to the right of the date box and select the Climate section for faster access). This section is found every Friday. The Climate section breaks out some very important indicators for you. You can check out the table provided and read the short write-up on the indicators. Per the climate section last Friday: “We currently have a Case 2, Bull market scenario in which earnings are rising, while inflation and interest rates are falling.”
The level of the AORD Earnings Trend Indicator is the key to knowing whether the market is in a bull or bear market scenario. A bull market scenario prevails when it is above 1.00, and a bear market scenario prevails when it is below 1.00. Last week, it stood at a healthy level of 1.73. So, with the ETI well above 1.00, a bull market scenario remains intact this week. For more information on bull and bear market scenarios, please see the VectorVest US Views of 21st March 2003.
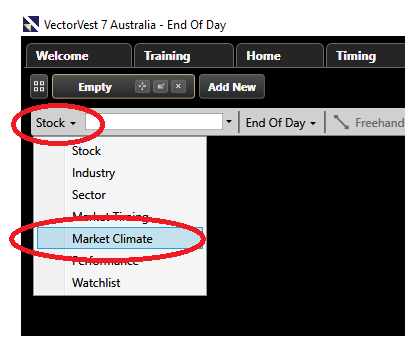
You can also find this key information in the Market Climate Graph (per the Graphs tab). If you click on the Graphs tab, and then select the Market Climate Graph, you can setup your graph to see all the key variables
You can setup your graph as follows:
Click on image to enlarge
To set this up:
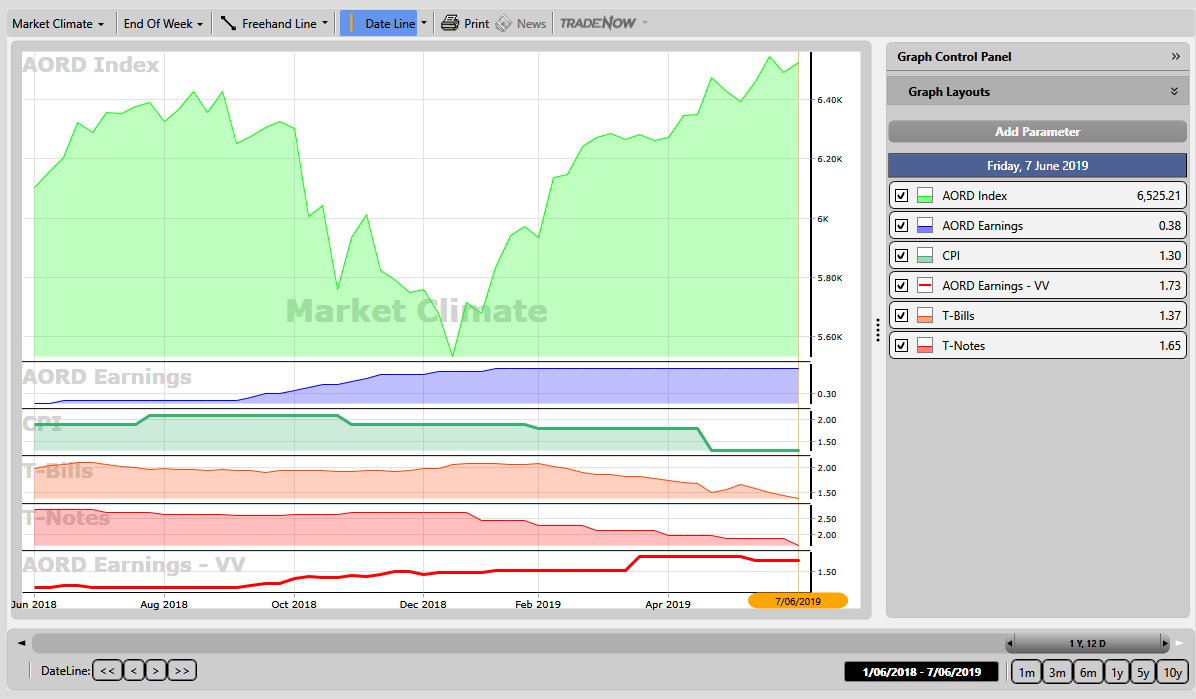
First, click on the Graphs tab, and per the top left, click on the dropdown arrow just to the right of Stock and then select Market Climate. This will open the Market Climate Graph. Firstly, we want to ensure that we graph the All Ordinaries Index. To do so, put on the AORD Index (click on Add Parameter per the top left of the page and select AORD Index to add in this parameter to the list of parameters if it is not already available for you to select). Ensure everything else is turned off for now by clicking and removing the check mark in the box to the left of each parameter. The next parameter to add is the AORD Earnings. You can add this in the same fashion you added the AORD Index. Graph this parameter along with the AORD Index. Over the last year, you can see how corporate earnings have been rising along with the AORD Index. This is the first ingredient for a rising share market.
Let’s now add in the interest rates and inflation rates to complete our macro analysis using the Market Climate Graph. Add in T-Notes and T-Bills and ensure these are graphed. Without going into too much further detail, both T-Bills and T-Notes measure the prevailing interest rates (T-Notes look at the longer prevailing interest rates, whereas T-Bills look at the shorter-term interest rates). Note how the T-Bills and T-Notes have both been steadily falling for many years now. Per the Climate sections in the VectorVest Views, you will also see that we break out the 90 Day T-Bills, the 10-Year Govt Bonds rate and the 5-Year AA Corporate rate too. No matter which measure you prefer, interest rates are at historically low standards! Our second key ingredient for a rising market has been in place for a long time.
The last indicator to add is the Inflation rate. Add the indicator: CPI. The Consumer Price Index (CPI) measures the current inflation rate in Australia. CPI is currently below 1.5% and sits at a very low value by historical standards of 1.3%. The Reserve Bank of Australia is trying to drive up spending to drive up inflation and, to do so, they have cut interest rates further. With a falling inflation rate, we can now see the third ingredient for a rising share market in place.
There are several other indicators you can add to your graph. One such indicator I like to keep on my graph: The AORD Earnings Trend Indicator (ETI). This indicator is on a scale of 0.00-2.00. The ETI will note a Bull market scenario where the indicator is above 1.00 and a Bear market when it is below 1.00 as noted last week. To add the ETI to your graph, add the parameter AORD Earnings – VV. Note how the ETI has been sitting well above 1.00 for many months. If you go back in time, to the GFC, the ETI broke below 1.00 in early 2008 and remained below 1.00 for the duration of the GFC!
And there you have it. You can then save this layout by clicking on Graph Layouts, then Save/Modify Layouts button, then clicking Add New Layout, give you Layout a name and click OK and Close such that you do not have to optimise the Graph to your preferences each time. This will give you all this information at your fingertips, accessible within a few seconds each day.


Leave A Comment