
by Leslie N. Masonson, MBA
Bel Fuse Inc. Inc., a Nasdaq-listed firm (BELFB) headquartered in Jersey City, New Jersey, with a workforce of 7,000 employees, has a long history being established in 1949. The company is engaged in the design, manufacture, and sales of products for telecommunications and networking applications in the United States and China, as well as in other countries in Europe.
Presently, Bel Fuse Inc. enjoys a moderate level of institutional support. A total of 118 institutions have shown confidence in the company’s prospects, collectively holding a 60% of the outstanding shares. Notably, Dimensional Fund Advisors LLP stands out as the largest institutional holder, with a stake of 7.2%. The Vanguard Group follows closely behind with 5.3%, It is quite surprising that insiders only hold a minimal 2.8% stake in the company.
In the last quarterly earnings report in late April, the company reported an earnings and revenue blow-out of 64.5% and 17.3%, respectively. Furthermore, Zachs Equity Research highly rated BELFB as a bargain stock in a May 8 report, based on its high rating on their proprietary “Fast-Paced Momentum” category where BELFB’s beta was clocked at a very high 1.72%. That means that the stock price moves 72% higher or lower than the general market averages. BELFB has a dividend of $0.28 which translates into a low yield of 0.48%. An average daily trading volume of 187,500 is sufficient to get a decent bid-to-ask spread.
BELFB is ranked #1 in VectorVest Electronic Components industry grouping among 42 companies, as well as #3 in the 247-stock electronic sector, and more impressively #4 out of 9127 stocks in the universe, certainly a winner in all respects. Back on April 26 its VST ranking of 1.13 was not even in the top 200 stocks, compared to the current VST 1.57 which puts it near the top.
BELFB Has Exceptional VectorVest Scores, Is Still Undervalued and Has Room to Run
VectorVest’s first-rate metrics for BELFB are as follows:
- Excellent Upside Potential: The Relative Value (RV) rating focuses on a stock’s long-term, three-year price appreciation potential. The current RV rating for BELFB is 1.66 which is significantly above average on a scale of 0.00-2.00. The current stock price is $57.974, while VectorVest places its value at $88.91, so it is definitely undervalued and has room to run-up to multiple new all-time highs.
- Good Safety: The Relative Safety (RS) rating is based on the company’s business longevity, financial predictability/consistency, debt-to-equity ratio, and additional risk parameters, including price volatility. Its RS rating of 1.10 is slightly above average, indicating below-average risk, which makes it suitable for conservative investors..
- Excellent Timing: The Relative Timing (RT) rating focuses on the price trend over the short, medium, and long term. The components include price direction, dynamics, and price magnitude of price changes over daily, weekly, quarterly, and yearly comparisons. BELFB has an exceptionally high RT rating of 1.88 compared to the average of 1.03 for all the stocks in the database which means that the stock has been a superior performer over multiple timeframes.
- Excellent Comfort Index: This index measures the consistency of a stock’s long-term resistance to severe and lengthy corrections. This index compares the individual stock to the fluctuation of the VectorVest Composite price that is measured on a scale of 0 to 2.00. At a level of 1.78, BELFB’s rating is extremely high. Therefore, this stock is well suited for all types of investors as it has exhibited mostly stable performance..
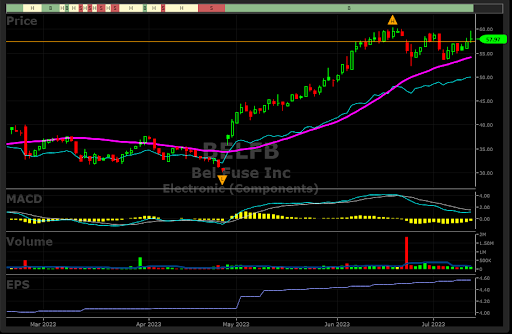
- Excellent Growth Rate (GRT): BELFB’s current sales growth over the last 12 months has been 26%, with an accompanied 39% forward-looking growth rate which are both exceptional. The latter is measured over a forecasted three-year period. As these fundamental factors are captured in the software, you don’t have to go to another source to capture them. The chart below highlights the multi-year positive earnings trend which had a downturn in late 2021, but did not turn around to the upside until March 2022, then jumped up again in July and November 2022, especially in May 2023. The stock catapulted from $30 to $57.97 as of the July 14, 2023 close.
- Excellent VST Score: The VST Master Indicator ranks 9,127 stocks from high to low and brings stocks with the highest VST scores to the top of the list. BELFB’s VST is 1.59, a high reading. Using VST enables subscribers to identify stocks that are performing much better than average, and BELFB is clearly a member of that elite category.
Upon examining the BELFB’s upward-sloping chart pattern (see below) since March 22, the stock did encounter a few speed bumps along the way in October 2022, January 2023, and even in late April 2023. However, from that point forward it has been a moon-shot, vaulting 92.5% since its April 25 low of $30.11. Comparatively, this performance far outshines the S&P 500’s modest 10.6% gain for that period.
Note that since June 23, the price has hit turbulence and is consolidating its gains before its next move to potentially take out its all-time high previously achieved on June 20 at $60.39. A price breakthrough above that level should provide clear sailing ahead, as there is no price resistance above that level. As long as the price remains above its40-dma (purple line), the stop price (blue line), and the MACD which is negative at the moment, but nearing a positive crossover, the odds favor it going higher.
A stock exhibiting such strong price momentum that is currently taking a breather for a few weeks, deserves close monitoring and should be at the minimum placed on a watchlist for potential purchase upon breaking out to a new high. Of course, your risk parameters should be foremost in making any buy or sell decisions.
Unquestionably, BELB has been one of the market’s top performers since April 26, as well as sporting a VectorVest “BUY” rating on that date where it presently stands. If you are considering a purchase, make sure that VectorVest’s current July 7 Confirmed Calls “BUY“ signal remains in place. To make sure that is the case, it pays to subscribe to VectorVest to track the Confirmed Calls so you don’t invest if the signal changes to a “Sell” indicating entry is not advisable. This software’s time-tested rules-based trading approach is invaluable in keeping investors on the right side of the market all the time – and that is the only place to be to preserve your capital.


Want These Types of Insights at Your Fingertips so You Can Win More Trades?
Use VectorVest to Analyze any stock free. VectorVest is the only stock analysis tool and portfolio management system that analyzes, ranks and graphs over 18,000 stocks each day for value, safety, and timing and gives a clear buy, sell or hold rating on every stock, every day.
Before you invest, check VectorVest! Click here to ANALYZE ANY STOCK FREE and see our system in action!


Leave A Comment