by Leslie N. Masonson, MBA
In my previous article, I reviewed the VectorVest ETF Viewer which contains a multi-column sortable database of over 1,800 ETFs. They are ranked on their VST (default), the master ranking criteria, which ranks them from the highest to lowest. Of course, any other metric column can be used to rank the universe for the highest or lowest rank with a mouse click.
As a first step to analyzing ETFs, the ETF Viewer provides the cream of the crop ranked by VST. Nevertheless; some investors and traders want a strategy that can pinpoint the future winners based not only on VST, but other potential factors including select fundamental and technical criteria. This will provide potential candidates for a watchlist or for immediate purchase if the market trend is up.
Those criteria could be a minimum or maximum price per share, minimum trading volume, price hitting a new high in the last day, MACD having a positive crossover today or in the last week, an RSI rising above 30 or a myriad of other factors that the user can input. All these items can be found built into the “UniSearch” strategies tab, located on the VectorVest Home Page.
This powerful tool offers hundreds of time-tested searches for stocks and ETFs encompassing all types of investing styles, risk parameters, technicals, price patterns and fundamentals, among others. Moreover, subscribers can develop and save any custom stock or ETF searches for future use. They can run the search at any time to find the ETFs that meet the criteria, then check them out in a chart so see if the trend is smooth or rocky, and then place those with the best patterns in a watchlist for the appropriate buy signal based on the VectorVest market timing indicator signal best suited for each investor’s risk tolerance.
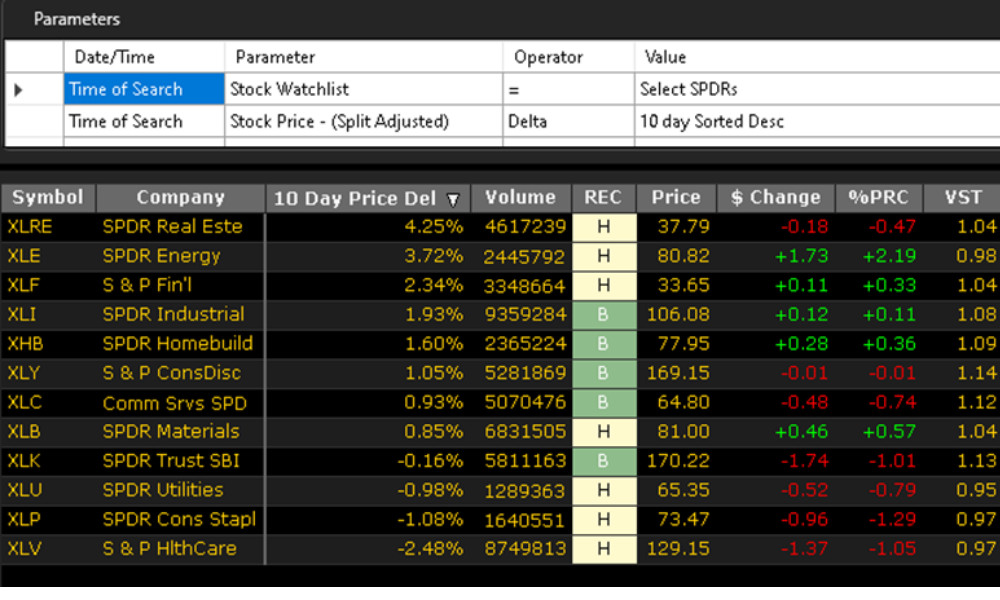
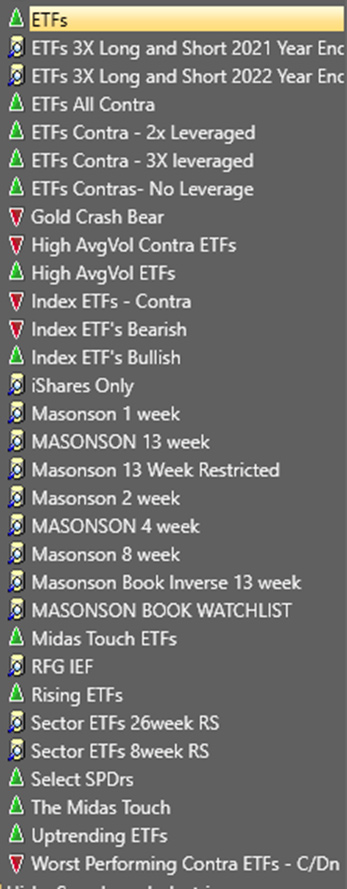
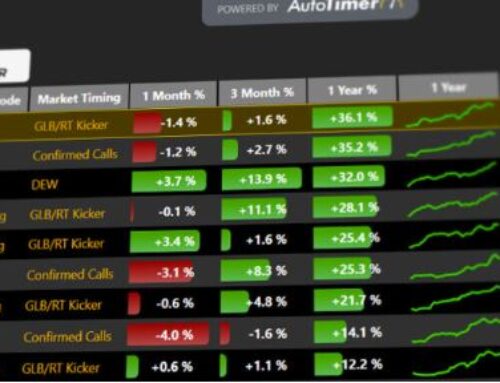
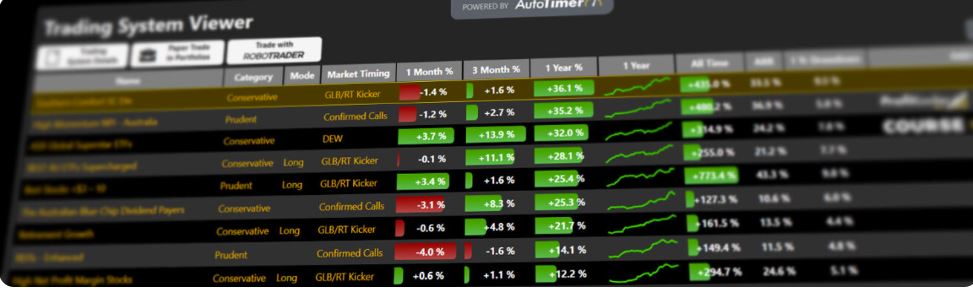
The first listing below shows the names of built in ETF searches, and my additions (Masonson) to this category. There are also other ETF searches embedded under some of the other general search categories. The second table below illustrates the “Select SPDRs” UniSearch which limits the universe to the well-known 11 SPDR sectors. In this example, another parameter added was the past 10 days price performance.
Additional search criteria could easily have been added including a minimum daily trading volume, a Relative Timing (RT) score greater than 1.10, and a recent cross of the 10-day and 20-day moving average. These additional hurdles will not only limit the number of ETFs coming up in the search, but making those ETFs that make the cut even better candidates for purchase.
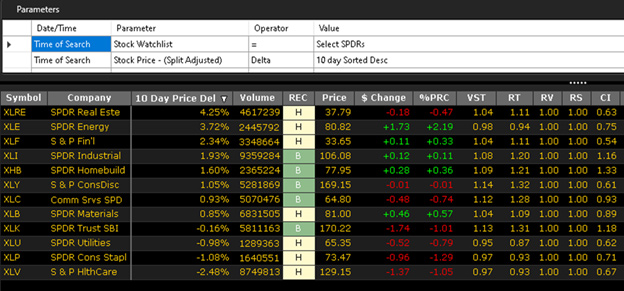
In the table below, the top ranked four ETFs out of the 11 based solely on price appreciation were XLRE, XLE, XLF, XLI, all rising more than 2% over this two-week period. This table can easily be sorted on any other column such as VST, RT RS, average volume to see which ETFs come out on top. For example, resorting based on VST, brings XLY, XLK, XLC, and XHB to the top of the list which are all different sectors from the four based solely on two-week price momentum. Interestingly those four were the only ones with a “BUY” rating.
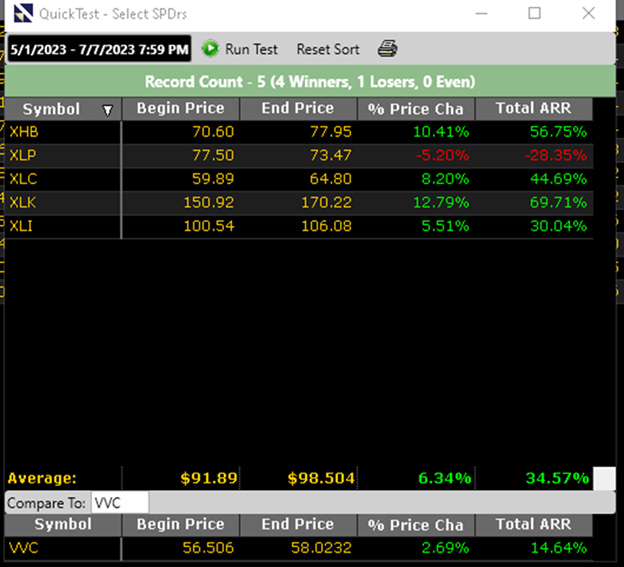
A UniSearch strategy can run from any user’s desired starting date and then can be used to do a Quick Test of the results to a future date. For example, running this search on May 1, 2023 and tracking the performance of the top five sectors (XHB, XLP, XLC, XLK and XLI) on that date through July 7 (see table below) resulted in a gain of 6.34% compared to the VectorVest Composite’s (over 9100 stocks) return of 2.69% which was an excellent comparative performance.
Tests of this type can be run for any time period, and can also be set up in the “Backtester” to see long term results with any UniSearch strategy. In summary, UniSearch provides users with a solid array of high-quality searches to ferret out the future stock market winners. Give it a try by taking out a trial subscription, if you don’t already have one.


Want These Types of Insights at Your Fingertips so You Can Win More Trades?
Use VectorVest to Analyze any stock free. VectorVest is the only stock analysis tool and portfolio management system that analyzes, ranks and graphs over 18,000 stocks each day for value, safety, and timing and gives a clear buy, sell or hold rating on every stock, every day.
Before you invest, check VectorVest! Click here to ANALYZE ANY STOCK FREE and see our system in action!


Leave A Comment