
Have you seen our recently revised Model Portfolios in VectorVest?
The three new Model Portfolios are:
- ETFs Portfolio
- Growth Portfolio and
- Income Portfolio.
Our other Model Portfolios remain unchanged at this stage (10 Stock Model Portfolio, SMSF Balanced Portfolio and Worry Free Investing Portfolio, currently under review).
In the past, we have not changed any variables in our Model Portfolios. However, we do not believe that a “set-and-forget” approach is realistic and going forward, to cater for significant changes in market conditions, we will “tweak” rules, such as stop-loss rules and More Settings like rules for replacing closed positions. When we do this, we will communicate these changes to our subscribers.
Over the next 3 weeks, I will explain in some detail each of the 3 new Model Portfolios found in the Portfolios tab on the Main tool bar. Let’s Start with the ETFs Portfolio.
ETFs Portfolio (Replaced the AU ETF Model Portfolio).
A minimum number of trades and an annualised return of over 20%… have I got your attention yet? The ETFs Portfolio is designed to find you the best international ETFs and Sector ETFs listed on the ASX. With sufficient liquidity and with appropriate stop-loss rules in place to minimise the downside, and importantly for our long-term investors, to allow for upside growth, all with a minimal number of trades. This portfolio is about as close as you can come to a buy and hold strategy using VectorVest.

Click or tap image to enlarge
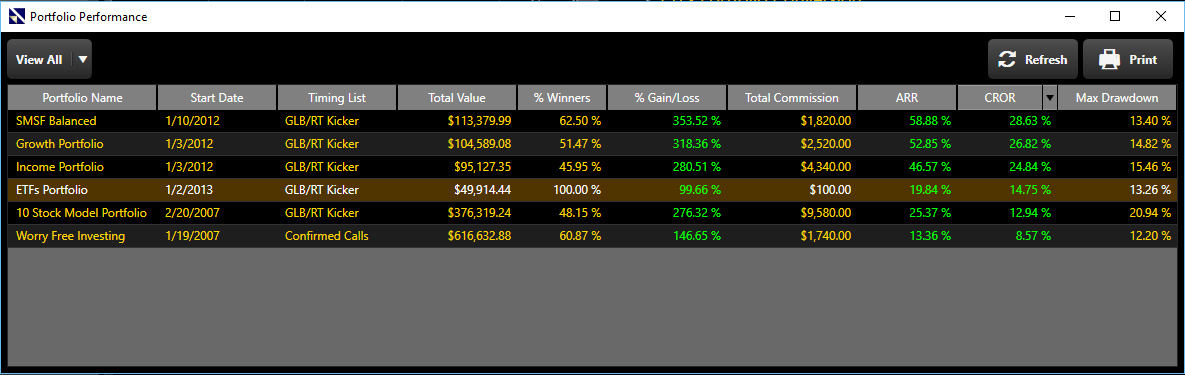
Based on the history of this portfolio, 5 ETFs have been held since 2013. This portfolio has annualised 20.6% as of 19 December. How did I work that out? I can check all the portfolio stats by clicking on the “Portfolio Performance” button on the bottom left of the
Portfolios Tab screen. This will open the Portfolio Performance window and list all the portfolios as found in the Portfolios tab (you can filter out any of the non VectorVest portfolios per the drop down menu at the top left of the Portfolio Performance window where you can choose from “View All,” “VectorVest Only” and “Personal only”).
The ETFs Portfolio tracks back to 2 January 2013 and has gained just over 98% as of 5 January 2018. The Maximum Drawdown is 13.26%. Maximum Draw Down is the most a portfolio has lost from a peak to trough cycle before any new peak took place (not bad at all for a portfolio showing nearly 5 years of history). To give us confidence in this portfolio’s historical performance, we need to go back in time. This sets the scene for what is possible going forward.
Click or tap image to enlarge.
Close out the Portfolio Performance window (by clicking on the X in the top right window of the Portfolio Performance tab). Back on the Portfolios tab with the ETFs Portfolio selected, click on the “Reports” button just above the upper right of the ETFs Portfolio Graph. You can run through some of the key reports provided. There is one report I want focus on, that being “View Summary Report.” Once you open this report, you will see that there have been 5 trades overall, the 5 ETFs bought back in 2013 are still being held (if you get a chance, graph the 5 ETFs currently being held to see some dazzling price patterns since the end of 2012 on all but 1 of the graphs).
Another report I want to draw your attention to is found under the “Details” tab in the top right corner of the Genius box. Click on the “Details” button for the Details Report which helps you see exactly what settings have been applied for this portfolio. The ETFs Portfolio uses the GLB/RT Kicker Timing System and an 11% trading stop. The portfolio holds no more than 5 ETFs at any point in time and will never hold more than 10% of an ETFs average volume. Notice the UniSearch applied for this portfolio BEST AU ETFs Supercharged. If you want to see the exact ETF screening criteria applied, you can open the ETFs folder in UniSearch and locate the BEST AU ETFs search. The UniSearch ensures that ETFs of $5 or higher are found, Relative Timing is >= 1.2, Comfort Index is >= 1.1 and sorted by VST Desc. This ensures the ETFs with the best long and short term price performance and the smoothest left to right graphs are found.
If there ever was a portfolio in Australia that involved minimal trades with strong performance, this is the portfolio to consider!
Written by: Robert and Russell Markham


Please provide information on the current VV portfolios.
I am particularly interested in considering a growth portfolio that is suitable for an SMSF
Hi Peter.
Thanks for your question. I put a couple of posts on VectorVest Australia Facebook.
Please check out our Facebook page: https://business.facebook.com/VectorVestAus
I did a couple of screenshots on the latest results on Facebook just recently.
As of the 23rd of April, the Growth Portfolio is up 46.89% year to date (from 2 January 2019 to 23 April). It has been phenomenal growth so far this year. We will keep the rule set, apply our marketing timing and let our risk and money management rules do the work for us.
In addition, check out the recent blog post:
http://vectorvestcomau.azurewebsites.net/have-you-seen-the-vectorvest-model-portfolios/
This blog post has a good update on the performance too.
Regards,
Russell.