THOMAS COOK (TCG.L) & DR. DILIDDO’S 4 STEPS TO PROTECTING PROFITS.
Written by: Robert and Russell Markham
No doubt you heard that Thomas Cook, the 179-Year-Old travel provider (ticker code TCG.L on the London exchange), has gone bankrupt. I heard about this on the news, with images of people stranded at airport, not knowing how they were going to get home after flights were cancelled following the collapse. Thomas Cook ran a holiday packages business and had an airline that flew thousands of people around the world. A considerable number of Australian travelers have been caught up in the collapse. There have been plenty of articles noting that it was mismanagement that cost Thomas Cook, laying the blame on the executives.
As an investor, were you holding onto TCG.L? As a VectorVest subscriber and follower of our teachings, I highly doubt it. VectorVest had plenty of warning signs along the way! I will put a short link at the end of this write-up to show you what TCG.L on VectorVest UK looks like (as chances are you do not have the UK as your second country). The methodology we teach here in Australia is applicable to the UK as it is to the US markets, or any other such market that VectorVest analyses.
Loading up VectorVest UK and heading over to Stock Viewer, I look up Thomas Cook and note the symbol is TCG.L. Bringing up TCG.L in Stock Viewer is revealing. The first thing that jumped out at me was that TCG.L had been rated a SELL for many, many months prior to the collapse. Next, I graphed TCG.L and applied the VectorVest Layout (by expanding the Graph Layouts selection on the right and selecting: VectorVest Layout). This loads up the Price, the 40-Day Simple Moving Average (SMA), the Relative Timing (RT) and you can add the Earnings Per Share (EPS) onto the graph. I set the graph timeframe to be at least 2 years (by adjusting the time frame at the bottom right of the screen). This is where I can see that for a good majority of the last 18 months, TCG.L has been a SELL rating (per the Buy, Hold and Sell rating at the top of the graph) with a share price that has been rapidly falling over that time.
The next thing that jumped out at me was the RT. RT has been below 1.00 for most of the year! A falling RT is noting a decline in the momentum of a stock. And the last notable decline has been in the EPS graph where I noted the decline taking place as far back as January 2019 followed by a significant deterioration in EPS by June 2019. Plenty of warning signs!
Had you followed Dr. DiLiddo’s 4 Steps to Protecting Profits, you would have been safely out of TCG.L several months ago. I wrote about Dr. DiLiddo’s 4 Steps to Protecting Profits back on the 25th of May 2018 in the VectorVest Essay and applied The 4 Steps on AMP.AX, DMP.AX and BAL.AX (if you have not seen this write up, I recommend you check it out). Let’s recap Dr. DiLiddo’s 4 Steps to Protecting Profits:
Step 1: Look for volatility and your stock price falling away
Step 2: Price falls below the 40-Day Moving Average (MA)
Step 3: Relative Timing (RT) drops below 1.00
Step 4: REC = Sell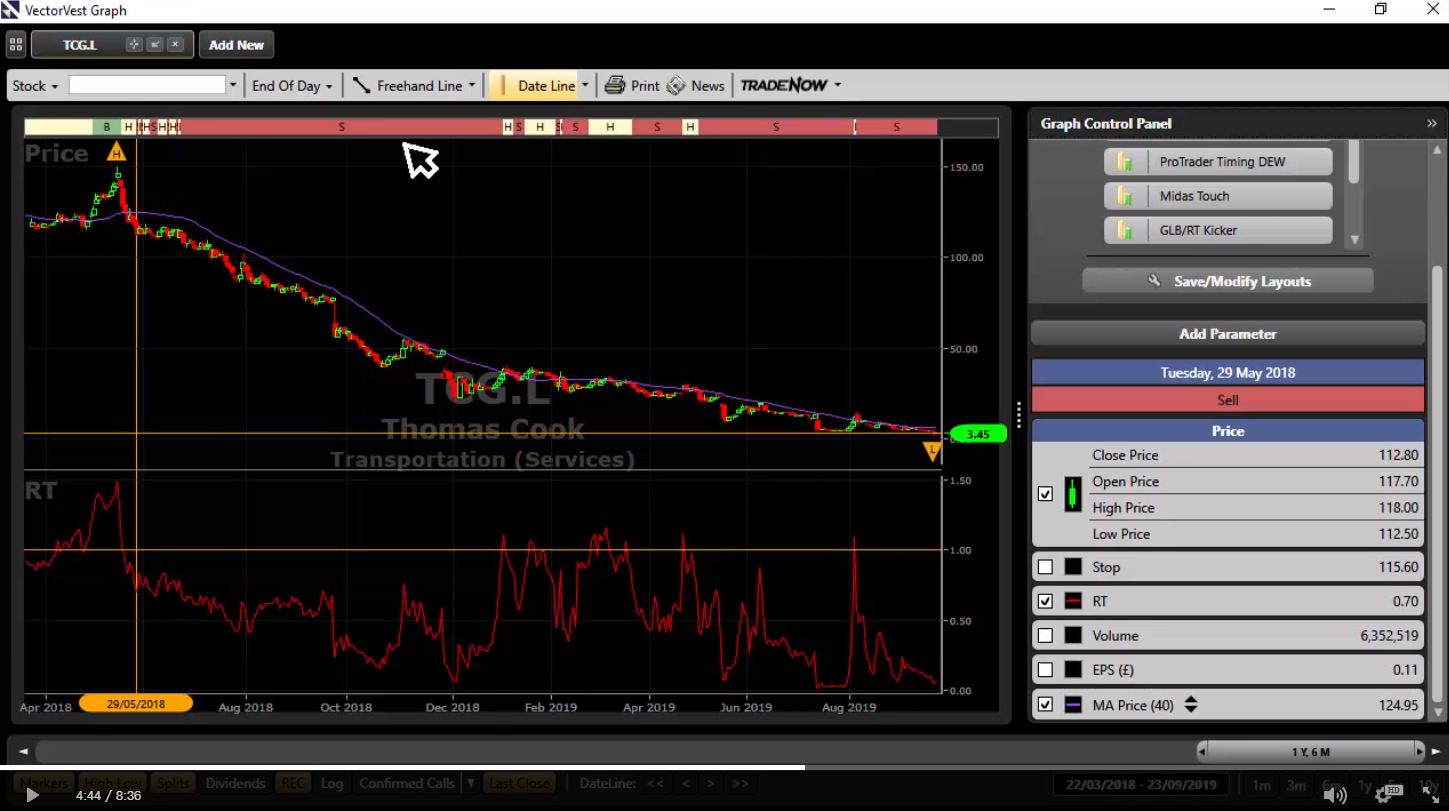 (Click on the image to enlarge for easier viewing)
If all 4 steps are met, then you need to seriously consider selling out if you have not done so already. For TCG.L, all four of these steps took place on 29 May 2018 (any many times more thereafter). The power of Dr. DiLiddo’s 4 steps in play yet again.
If you have your BackTesting perfected with given stop-losses that you are happy with, then stick to your trading plan. But for those of you who do not have stop-losses in place or have a few shares you are not sure about when to sell, have a look at Dr. DiLiddo’s 4 Steps for your stocks!
Please click here to see TCG.L in the UK and how it appears in VectorVest leading up to the collapse.


Leave A Comment