THE BIG BANKS’ EARNING PROFILES!
Written by: Robert and Russell Markham
Our biggest four banks all have falling earnings! I wrote about The Commonwealth Bank of Australia (CBA.AX) back on the 31st of May, per the VectorVest Essay, entitled, “Commonwealth Bank of Australia’s Earnings.” Today I want to take a closer look at the earnings for next 4 biggest banks in Australia, that being: Westpac Bank (WBC.AX), ANZ Bank (ANZ.AX), National Australia Bank (NAB.AX) and Macquarie Group (MQG.AX).
To get started, let me show you a quick way to find all banking stocks in Australia. Click on the Viewers tab, then select Stock Viewer. In Stock Viewer, just to the right of the magnifying glass image per the top of the page, you will see blank box, enter in CBA.AX and press ENTER on your keyboard. This will return CBA.AX and filter out all the other stocks. Now, here is the magic trick, just simply double click your mouse anywhere on the highlighted row for CBA.AX. This will open a new window where all the banking stocks (20 of them currently) will be listed. The next step is to click on the blue up and down arrow symbol per the top left of the page. This will open an Edit Sort box. Set the Primary Sort to be Mkt Cap($ M) (by clicking on the dropdown arrow and scrolling down until you find Mkt Cap ($M) and ensure the DESC radio button is selected. This will ensure all the banking stocks are sorted by Market Capitalisation in Descending order. Market Capitalisation is simply the current share price multiplied by the number of shares outstanding, that being the Shares$(M) column. This is just a way of saying by largest company through to smallest company. Per 8th October, the top 5 biggest banking stocks by Market Capitalisation are: CBA.AX, WBC.AX, NAB.AX, ANZ.AX and MQG.AX
Let’s now graph the Top 5 stocks and check out the earnings profiles (EPS) for each. To do so, click on the first stock CBA.AX and then hold down your control key and click on the next 4 stocks, such that you have highlighted CBA.AX, WBC.AX, NAB.AX, ANZ.AX and MQG.AX. Once you have these stocks highlighted, right click on the highlight and select View Stock Graph. Once the graph of the first stock CBA.AX loads up, change the layout to be VectorVest Simple (per the Graphs Control Panel on the top right of the graph, you may need to expand the Graph Layouts by clicking on the double down arrow icon if it is not expanded per your view already). Set the graph to be five years by clicking on the 5y button per the bottom right of the graph. Remove the Relative Timing (RT) and the Stop Line from the graph by unselecting them. All I want to look at is the EPS and the Share price. Let’s look at CBA.AX, the first graph.
(Click on the Graph to enlarge)
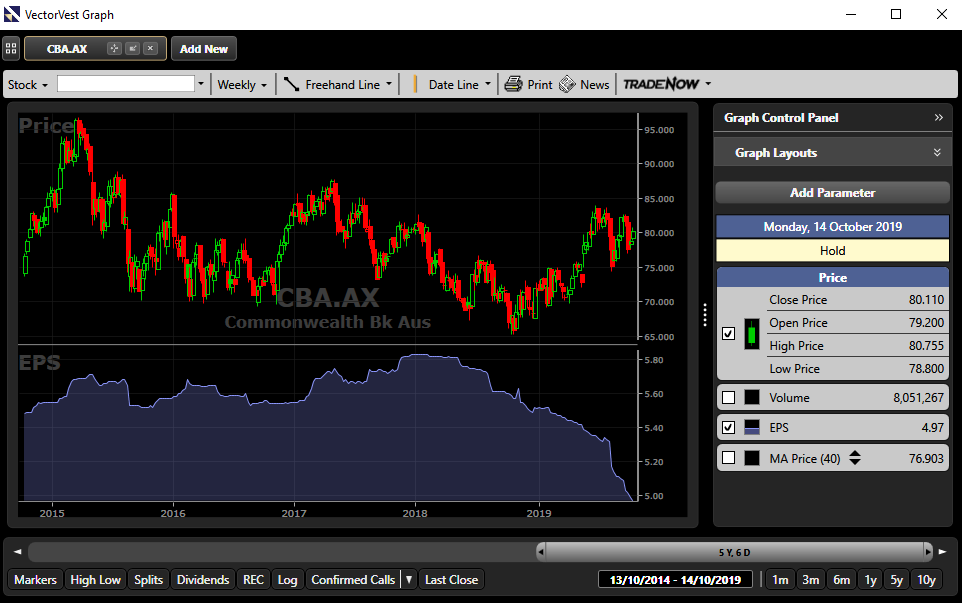
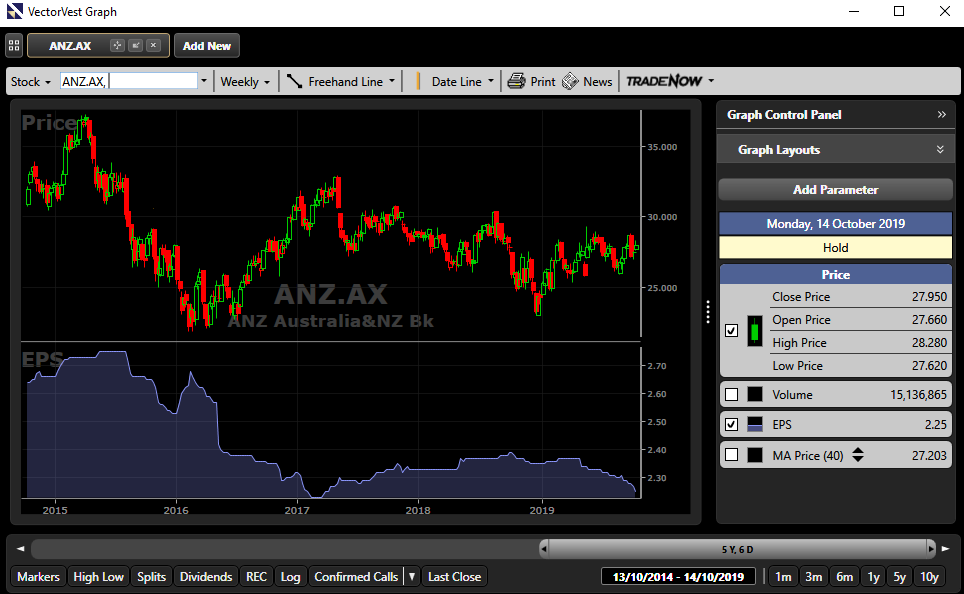
CBA.AX has had a significant fall in earnings that started to take place as of May 2018 and continued to head south along with the share price. Make no mistake, falling earnings will result in a falling share price! CBA.AX’s earnings continue to fall. Scroll to the next graph (click on the down arrow per the bottom right of the page) to bring up WBC.AX. Here you can see the impact of falling earnings since April 2016 and how the share price has continued to drop away. WBC.AX has a rapidly declining EPS at present. Click for the next graph, NAB.AX. The EPS profile for NAB.AX has the most consistent falling pattern so far. The share price has been under significant pressure over the last 5 years as a result. Click for the next graph, ANZ.AX. The EPS profile for ANZ fell away heavily in late 2015 with another heavy drop in mid-2016. Earnings did recover slightly in 2017, but by 2019, the earnings were on the slide again. The share price over the last 5 years has followed the earnings down.
(Click on the Graph to enlarge)
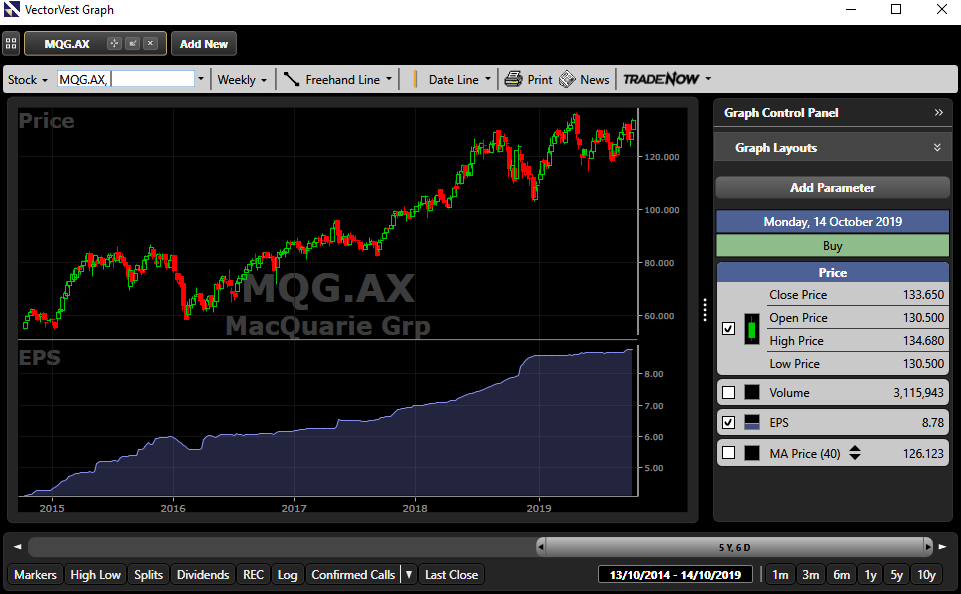
At this point, you could be forgiven for thinking that the big banks are not likely to show much in terms of earnings. But if you click to get the last graph, MQG.AX, you will see a great set of earnings! Wow! This one stands out. Notice the strong correlation between the earnings and the share price.
(Click on the Graph to enlarge)
The lesson from this is that there is always a diamond in the rough. We know banks are under significant pressure at present due to the Royal Commission and the tighter restrictions on lending. But that is not to say that there is not a stock out there that is powering along in an industry that is under pressure. I have seen shining examples of success in struggling industries time and time again over the years. You have the tools to explore the given industries and sectors, let the numbers guide you and not your emotions.
On a final note, per a recent webcast Q&A session I ran on the 26th of September, I bench marked the banks using the performance graph in VectorVest. No prizes for guessing who the top performer was. If you missed the webcast, please Click Here to see the recording if you missed out! The bank analysis begins in the 37th minute.
DISCLAIMER: THE ABOVE ARTICLE DOES NOT CONSTITUTE FINANCIAL ADVICE. PAST PERFORMANCE IS NOT INDICATIVE OF FUTURE RESULTS. YOU SHOULD CONSULT WITH YOUR LEGAL, TAX, FINANCIAL, AND OTHER ADVISERS PRIOR TO MAKING ANY INVESTMENT


Leave A Comment