How much impact does the news, and the emotion-driven decisions it causes, have on the stock market’s long-term growth? Or more importantly, the growth of your own retirement portfolio? It seems that no matter what stumbling block the market may encounter, it always manages to bounce back (eventually), which is why many professional advisors would have their clients hold their shares even through the most problematic market periods.
I wonder if they would follow their own advice though. What if it was their portfolio that was down 40-60% and they were looking to retire next year?
“Staying the course” can deliver severe consequences, ones that most investors (if they’re human, awake and not an advisor) may not have the fortitude to withstand. The pain and exuberance encountered during these market swings often causes “trading common-sense” to fly out the window – sometimes permanently. Hope, Fear and Greed take turns jumping into the driver’s seat, ready and willing to take your portfolio for one heck of a wild ride. Let’s look at the possible impact of these ill-advised trips and what you can do to avoid them.
1. Greed decides that the gravy-train is never going to end and convinces you to keep buying despite dangerous, overbought situations. Even when a correction comes, Greed cheers that this is a killer buying opportunity! So what if you’re holding a 20% loss. If you buy more now you can lower your cost-basis and dollar-average your way to being a multi-millionaire in no time! But that’s not what happens.
2. Hope gently nudges Greed out of the way and admits while things could be better, they’re not that bad. The market will turn around. It always does, just hang in there; everything will be ok before you know it. But it isn’t.
3. Fear shoves Hope out the driver’s side door and plunks himself behind the wheel. Is there no end to the bad news?? Horrible headlines – plunging earnings, political debacles, global catastrophes! This crazy ride is over, Fear slams on the brakes. Everything is liquidated to preserve as much of your nest egg as still possible, just in time for the market to take off and leave you in its dust.
The market doesn’t have to have the last laugh though. There’s a simple way you can take advantage of the high, long-term returns the stock market offers without the masochism of enduring 40%+ market corrections – and it’ll help you put your emotions in the backseat!
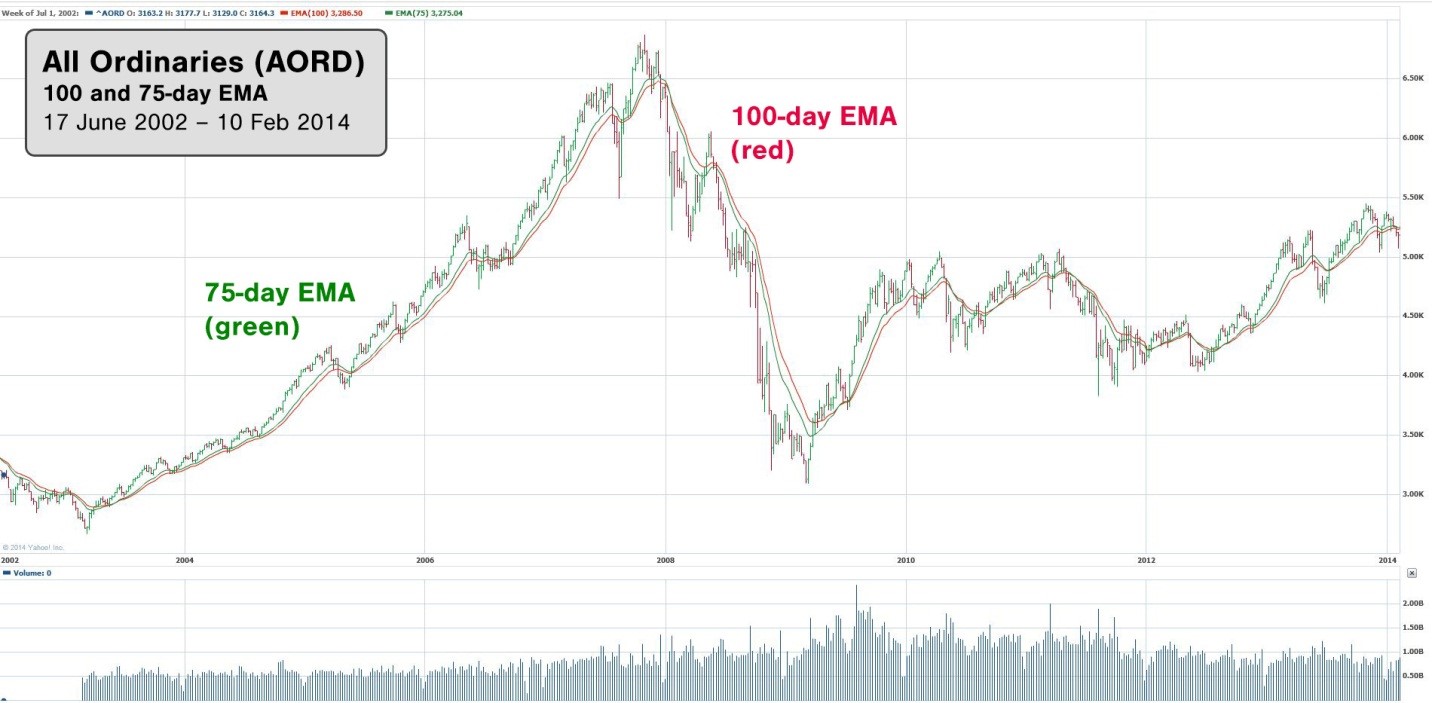
Look at the first chart below, the ^AORD is up 67.5% from its close of 3204.50 on 17/6/02 to its close of 5366.90, 12 years later, on 10/2/14. Of course, it would be up much higher if it weren’t for the bear market (8/10/07 to 2/3/09) which reduced gains by a whopping 53.97%. Subsequent corrections were considerably less severe, but took their toll as well.
Based on this chart, buy-and-hold investors that started their portfolios twelve years ago would only have a modest average annual return of 5.6% (67.5%/12 years), while investor’s that started their portfolios post 2006 may still be struggling to get back to ground zero (despite eight years passing by). This should demonstrate that blindly holding stocks through corrections can lead to diminished returns and unnecessarily high risk profiles for investors, so let’s apply the fix.

The FIX: Now, let’s take a look at an easy solution to drastically reduce the worst of the market’s severe downturns without changing our status as long-term investors.
The next graph shows two exponential moving averages of the ^AORD- a 75-day and a 100-day. The crossover of these moving averages gives a clear signal of when to protect profits (i.e. time to sell) and when it’s time to resume buying shares. This should keep you on the road to buying low and selling before it’s too late.
Now let’s gauge the effectiveness of our fix. Since we know the AORD is up 67%, we can add the losses that were encountered during each correction to find the highest possible, shoot-for-moon, gain. This would be approx. 390% (Add the points from every peak to trough and every trough to peak: 12,554.20, which is 391.77% increase from our starting value of 3204.50)

Using the graph above, the first date that we can conclusively determine the 75-day moving average is below the 100-day moving average is 17/6/02, where the AORD closes at 3204.50. Using this as our exit, we would have avoided a 15% pullback before the market took off in 2003. Our moving averages then caught the major up move, crossing to the bullish side and signaling a re-entry on 4/6/03 at 2996.60.
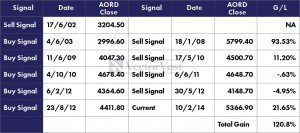
Following this same method, the AORD would have received five ‘sell’ signals in the 12 year period shown by the chart above. Acting on these signals resulted in a total AORD gain of 120.8% vs. the 67.5% sited above. There were two periods that ended in losses, the biggest loss being less than 5% vs the 53% loss encountered during the bear market. Higher returns, less risk – a considerable improvement.
This objective approach provides “Road Signs” for the market’s direction and can continue to deliver a significant improvement with minimal effort. Stop-losses and smart money management techniques should also be used to enhance the results even further. Adding a few more timing conditions for a slightly more sophisticated market-timing system may also prove to be very beneficial.
Don’t expect your timing system to be perfect though, it’s simply not necessary or realistic. The real winners are systems that adapt fast enough to reverse a false signal, getting you out of bad situations quickly with minimal damage. Accuracy and adaptability must balance if you want a good system. And if it all sounds too complicated and you just don’t want to bother, you can always take a look at the VectorVest timing systems.
Long ago (26 years to be exact), VectorVest defied conventional investment wisdom by teaching the crucial importance of determining the market’s direction before you invest. Each of VectorVest’s timing systems are rule-based and provide clear signals to buy or sell for a diverse range of investment styles – from swing trading to long-term investing. You can sample VectorVest’s stock analysis for free using the link above and take advantage of the 5-week trial-offer to explore the full system, including tested and proven market timing signals that will help you buy low, sell high and protect your portfolio all the way to retirement.


Leave A Comment