THE GLB/RT KICKER MARKET TIMING SIGNAL.
Written by: Robert and Russell Markham
Last week we got our very first signal noting that the market was starting to show signs of turning! The signal that flashed up was the Primary Wave. Since last week, we have had 2 further Primary Wave signals flash up (please see last week’s Essay for more details). This week as promised, I want to concentrate on the GLB/RT Kicker Timing signal which is also starting to give us some early signals.
To begin with, what is the GLB/RT Kicker Timing signal? The GLB/RT Kicker signal stands for Green Light Buyer/Relative Timing Kicker signal. The GLB/RT Kicker Timing signal is a middle-of-the-road Timing signal. It is not our most aggressive Timing signal (the Primary Wave is), nor is it the most conservative Market Timing (the Confirmed Calls is our most conservative). The GLB/RT Kicker signal is one of our most popular Timing signals in Australia (and around the world for that matter). The best way to explain this Timing signal is via the Market Timing Graph.
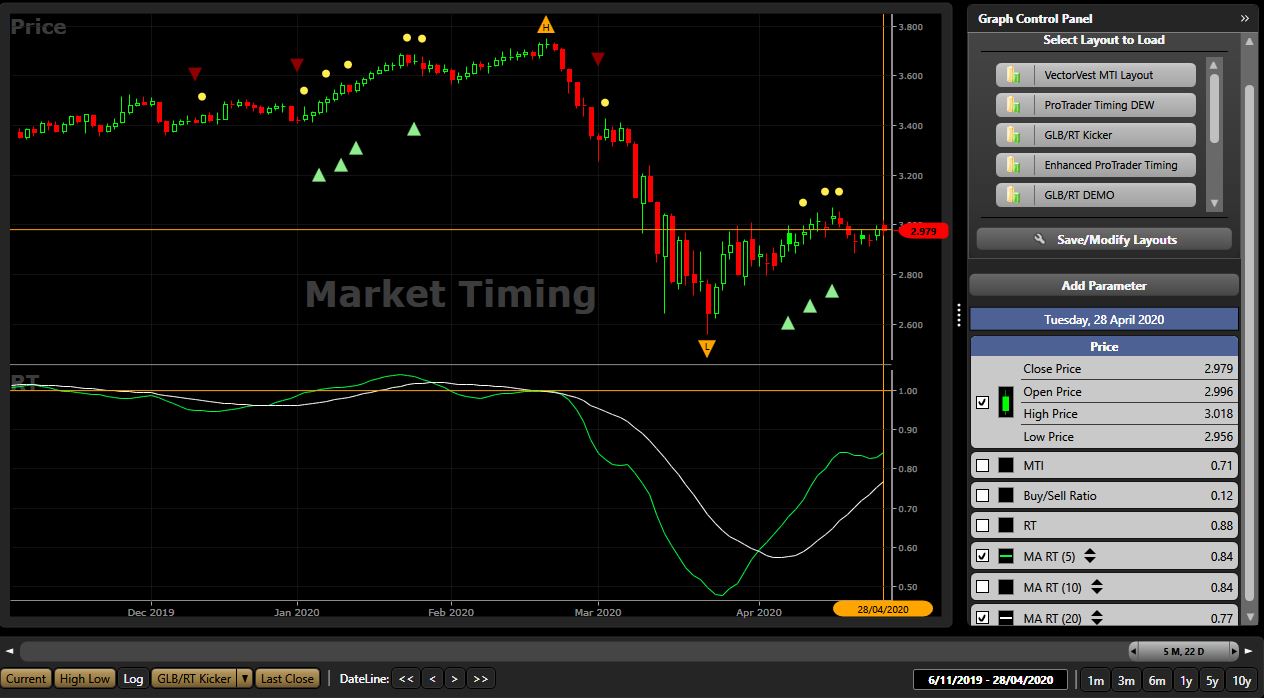
To demonstrate, click on the Timing tab in VectorVest (per the top of your screen) and then on Market Timing Graph. Next step, per the Graph Control Panel, on the top right of the screen, open the Graph Layouts Panel (click on the double down arrow to expand all the graph layouts). The layout I want you to click on is the GLB/RT Kicker layout which will open the GLB/RT Kicker Market Timing Graph. Then click on the dropdown arrow to the right of Confirmed Calls per the bottom left of the graph and select GLB/RT Kicker as the Market Timing signal. You now have everything you need to see how the GLB/RT Kicker Timing signal works.
Let’s get into the mechanics now of how it works. To get a GLB/RT Kicker up signal (green up triangle), the following must occur:
1. A green light must take place in the Price column of the Color Guard (per the HomePage).
2. The 5-Day Simple Moving Average (SMA) on Relative Timing (RT) must have crossed above the 20-Day SMA on RT.
The first requirement ensures that the market must be moving up week-over-week as well as having moved higher from the prior day. When this takes place, VectorVest will display a green tile in the Price Column of the Color Guard.
The second requirement: VectorVest calculates the RT each day for the market, as represented by the VVC/AU (in addition to all the stocks we cover). A rising RT for the market notes that the market is moving up across all the stocks we track on average for (just over 2,000 currently). The GLB/RT Kicker Timing signal applies two Moving Averages to the RT for the market. The shorter-term MA for RT for the market (per the 5-Day SMA) must be crossing above the longer-term MA for RT for the market (that being the 20-Day SMA) to satisfy the second condition.
When the 2 above requirements take place, a GLB/RT Kicker up signal is given! The reference to “Kicker” in the name is to do with the fact the GLB/RT Kicker will ignore any green lights in the Price column of the Color Guard where the 5-Day SMA on RT for the market is below the 20-Day SMA on RT for the market. In other words, green lights in the Price column of the Color Guard will be kicked out unless it meets the aforementioned criteria.
The down signal is when there is a Confirmed Down signal in the market (our most conservative of all our Market Timing signals). There is one further signal, a neutral signal. Let me break out rules below:
Up signals are given when:
1. A Green Light is signaled in the Price column of the Color Guard.
2. The Relative Timing (RT) kicker is established when the following condition occurs while analyzing the VectorVest Composite (VVC/AU): 5-Day SMA RT > 20-Day SMA RT.
Down signals are given when:
1. The Confirmed Call becomes C/Dn.
Neutral signals are given when:
1. There is not a Green light signaled in the Color Guard Price column OR the 5-Day SMA RT <= 20-Day SMA RT.
2. The Confirmed Call is not C/Dn.
The key takeaway: The GLB/RT Kicker Timing signal is a powerful and reliable Timing signal that has proven itself year-in and year-out. It will keep you on the right side of the market. When the GLB/RT Kicker signals start flashing up, you know the market momentum is turning to the upside!
You don’t have to go through all the mechanics like I did per the Essay this week. But the information is there for those who like to drill into the detail. As you can see, the GLB/RT Kicker is a powerful Timing signal that has a fair bit to it.
Where are we currently? The first signal for the GLB/RT Kicker took place on 7th April. The 5-Day SMA on RT for the market continues to hold above the 10-Day SMA for RT on the market…the ingredients are in place for further signals!
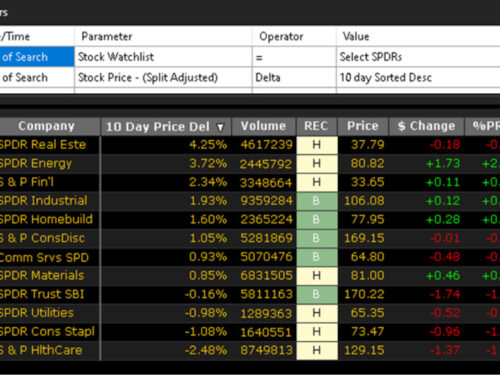
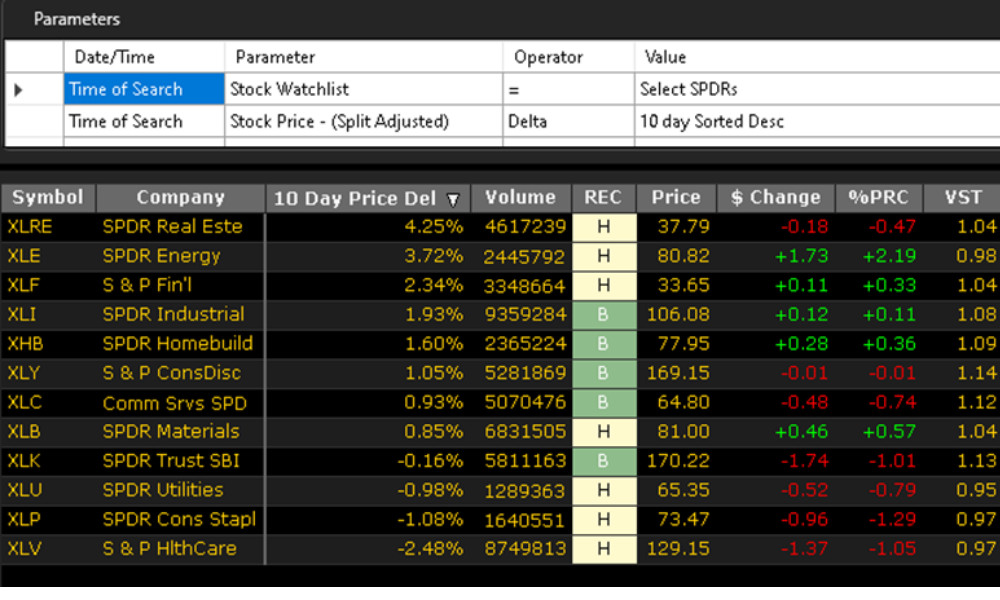
You can check out the signals each day to ensure you are kept on the right side of the market. If you follow the GLB/RT Kicker Timing signal, now is the time to have your shopping lists ready.


Leave A Comment