THE DEW TIMING SIGNAL.
Written by: Robert and Russell Markham
I wrote about the GLB/RT Kicker Timing signal last week, and this week I see that we have got a 4th GLB/RT Kicker signal on the 15th of April (the others being the 7th, 8th and 14th of April).
This week I wanted to look at a DEW Timing signal which has worked very well over the years. It is slightly less aggressive than the GLB/RT Kicker Timing signal. Before we take a close look at how the DEW has performed, let us look at how the DEW signal works. The best way is to check out the DEW Timing signal is on a Market Timing Graph.
Click on the Timing Tab and then Market Timing Graph. To the right of the screen where it notes Graph Layouts, click on the double down arrow to expand the Graph Layouts you can chose from. Click on the Layout entitled ProTrader Timing DEW. Per the bottom left of the graph, just to the right of Confirmed Calls, you will see a dropdown key. Click on the dropdown key and select DEW. This will ensure the DEW Market Timing signal is selected.
The name DEW represents 3 key things:
D – Detrended Price Oscillator (DPO). The DPO oscillates above or below 0. Notice the Oscillator per the area graph.
E – Envelopes (notice on the graph there is an upper envelope and a lower envelope that runs above and below the average of all the stocks we track, that being the VVC/AU)
W – 30-Day Weighted Moving Average (MA). There is a 30-Day Weighted MA applied to the average of all the stocks we track (VVC/AU) – per the white line on your graph.
Let’s keep this simple, the DEW Up signal is given when the VVC/AU pierces above the 30-Day Weighted MA and the DPO is above zero. If you have a look on the 6th of January this year, you can see the DPO went above zero and the average of all the stocks were track pierced through the 30-Day Weighted Moving Average.
Here are the exact rules, as there are some exceptions:
Up signals are given when:
1. The price of the VVC/AU is above the 30-day Weighted Moving Average
2. The DPO is positive
*If the lower envelope is pierced in a Down wave, the Up signal only requires one of the two prior conditions to be met. (Rarely happens)
Down signals are given when:
1. The price of the VVC/AU is below the 30-day Weighted Moving Average
2. The DPO is negative
*If the upper envelope is pierced in an Up wave, the Down signal only requires one of the two prior conditions to be met. (Rarely happens)
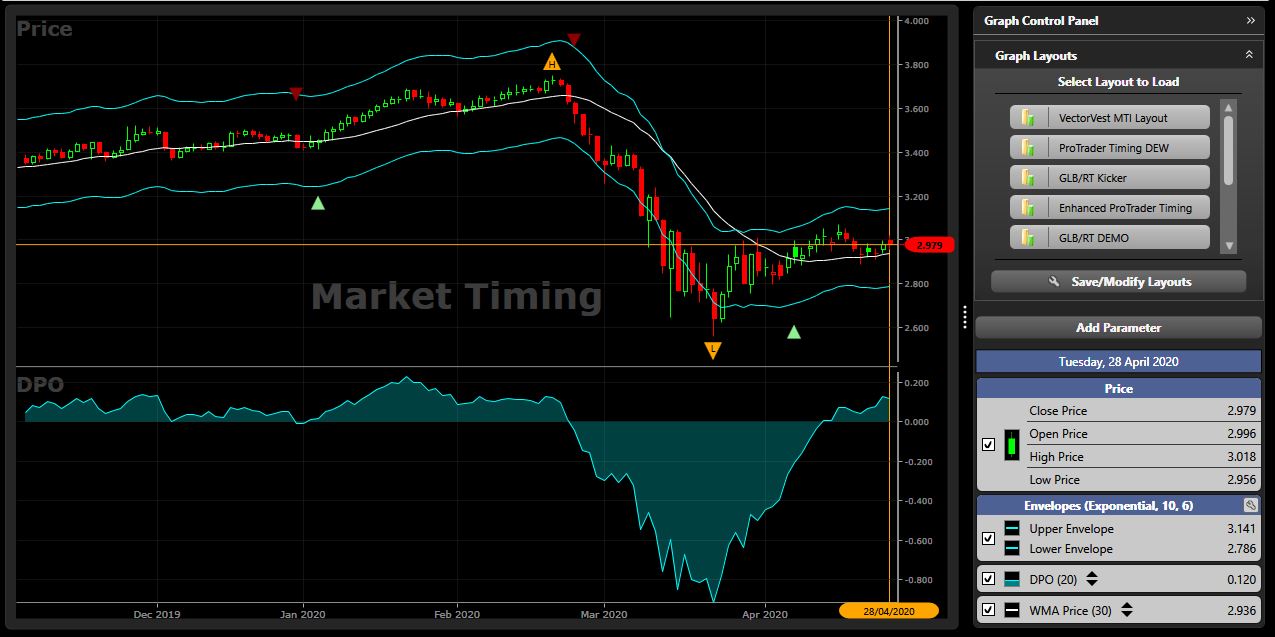
Notice the last DEW Up Signal given on the 7th of April, the Price of the VVC/AU pierced through the 30-Day Weighted Moving Average. So, the first rule is met. But look closely at the DPO on the 7th of April, the DPO is not above zero! Why then do we then have a DEW Up signal? In extreme situations, the VVC/AU pierced through the upper or lower envelope, only 1 of the signals is required for a DEW Up or Down signal. On the 9th of March, the VVC/AU closed below the lower envelope. As a result, a DEW Up signal would now only require either the DPO going above 1.00 or the VVC/AU breaking through the 30-Day Weighted MA for the VVC/AU. The VVC/AU broke through the 30-Day Weighted MA on 7th April and triggered the DEW Up signal!
So how has the DEW performed in recent times? Turn off all the indicators on the graph except for the VVC/AU (the average price of all the stocks). Keep the DEW Timing signals on. Set the graph to be 1 year (1y). The last DEW down signal was given on 25th February! Wow! That really nailed the start of the turning point for the wave down. The latest DEW Up signal flashed up on 7th April, again nailing that turning point. Pull back the graph a few more months to check out how the signals have stacked up in recent times. Recall the pullback in the market towards the end of 2018, the DEW once again nailed the turning point giving the DEW Down signal on 6 September 2018 and followed this up with a pinpoint accurate DEW Up signal on the 28th of December 2018 to take advantage of that great run we had in the market at the start of 2019.
BackTest some of your favourite strategies using the DEW next time you are looking to perfect your trading system!
Out of interest, by my count, the VVC/AU has only ever pierced the lower envelope on 20 occasions since 2007 (taken on closing prices for the day), thirteen of those in 2008 and seven this year in March:
22 January 2008, 8 October 2008, 9 October 2008, 10 October 2008, 13 October 2008, 16 October 2008, 24 October 2008, 27 October 2008, 28 October 2008, 18 November 2008, 19 November 2008, 20 November 2008, 21 November 2008, 9 March 2020, 11 March 2020, 12 March 2020, 16 March 2020, 18 March 2020, 19 March 2020, 23 March 2020.
35% of all cases where the lower envelope has been pierced since 2007 has taken place in March 2020. This depicts how extreme the Coronavirus market volatility has been!


Leave A Comment