HOW THE TOP VST STOCKS STACKED UP RELATIVE TO LICS AND ETFS.
Written by: Robert and Russell Markham
This is a follow up to the Essay back on the 3rd of May this year where we had covered LICs relative to Top VST Stocks. This time, I also want to include ETFs as part of the analysis.
To begin with, let’s define what an LIC is. LIC stands for Listed Investment Company. An LIC is effectively an investment fund. The LIC has a set number of shares via an Initial Public Offering (IPO) and you can buy and sell the LIC shares as listed on the Australian Stock Exchange. The LIC sets out to outperform the market and typically invests across a wide range of shares. An LIC lists their Net Asset Value (NAV) each day, where the NAV is often dated back a few days. The NAV is what the funds under management are worth at a point in time. So theoretically, the NAV should equate to the share price of the LIC. However, many LICs trade at a discount to the NAV which continues to be a source of frustration to investors in LICs. Some of the reasons for the discount in the share price relative to the NAV include a loss of confidence in management, poor performance, out-of-date NAVs (relative to the trading day) and lack of liquidity. A premium on the share price relative to the NAV can take place where investors are chasing after an LIC.
So, what about ETFs and what is an ETF? An ETF stands for Exchange Traded Fund. ETFs are like LICs, where managers are managing an investment from which you can buy into per the Australian Stocks Exchange. ETFs invest into assets that track an underlying index. For example, an ETF that tracks the Gold Index such as QUA.AX. An ETF not only invests into shares, but can look at other investments outside of shares. For example, an ETF can invest into commodities, bonds, property and other such assets. ETFs have market makers which in turn means that the value of the ETF is effectively reflected in the price. LICs on the other hand do not have market makers and as such they are dependent upon demand and supply of the LIC shares to the market to set price, hence the discounts and premiums to the NAVs that can result.
The question I ask today: Who has been the better performer? ETFs, LICs or Top VST Stocks?
Let’s Compare the Top 10 LICs and ETFs as ranked in VectorVest by VST. For this exercise, I am going to go back over the last 3 years, run a QuickTest and let the numbers do the talking:
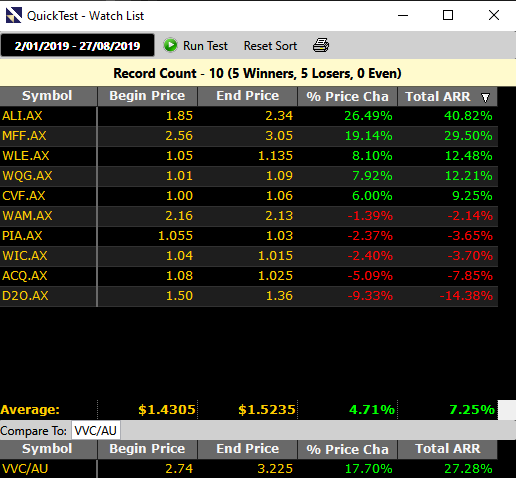
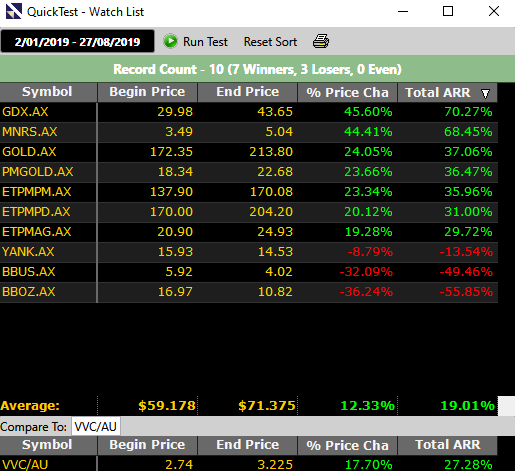
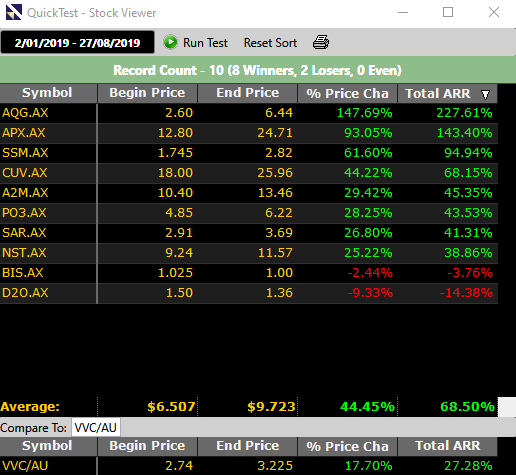
2019: 2 January ’19 to 27 August ’19 – Top 10 Tested
LICS: 4.71%
ETFs: 12.33%
VST: 44.45%
2018: 2 January ’18 to 27 August ’19 – Top 10 Tested
LICS: -12.37%
ETFs: 9.00%
VST: 70.34%
2017: 3 January ’17 to 27 August ’19 – Top 10 Tested
LICS: -12.26%
ETFs: 16.50%
VST: 19.59%
Here are the screen shots for the 2009 run for ETFs, LICs and Top VST Stocks:
Top 10 LICs per VectorVest on 2 January 2019:
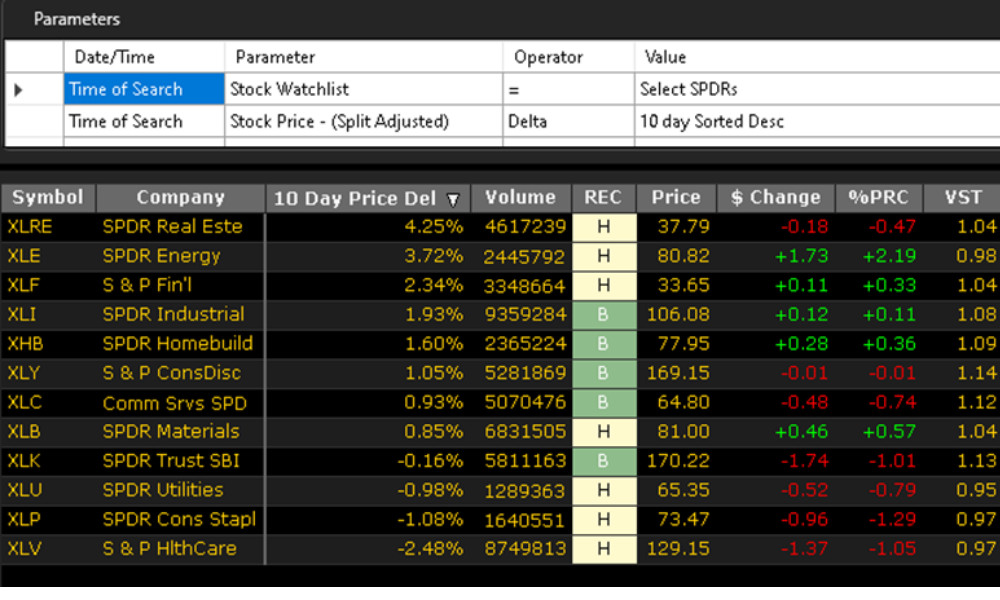
Top 10 ETFs per VectorVest on 2 January 2019:
Top 10 VST Stocks per VectorVest on 2 January 2019:
LICs, ETFs or Top VST Stocks? The answer stands out…the Top 10 VST stocks are outperforming the fund managers with a significant performance in the last two years. It must be noted that QuickTesting from point-to-point does not consider any risk or money management rules. It is purely a raw test. Nonetheless, it shows you the power of VST relative to LICs and ETFs.
You have the tools to be your own fund manager where you get full transparency!


Leave A Comment