
FINDING THE HOTTEST STOCKS ON THE ASX 100, 200 AND 300 INDEXES.
Written by: Robert and Russell Markham
Finding stocks that are exploding in price and then jumping in for the ride can be very lucrative. But it must be noted, it is very risky if you simply buy, hold and hope. Let’s have a look at some of the top-rated technical stocks on the ASX 100, 200 and 300 at the start of the year and see how well they have performed so far. Why am I looking at the ASX 100, 200 and 300 stocks? A lot of investors like to purchase big household names which are in these indices (You can of course do this analysis in Stock Viewer and not restrict yourself to a given set of indices). For this exercise, I am after some of the bigger market capitalisation companies. Market capitalisation is the current share price multiplied by the number of shares outstanding. We track this each day in VectorVest. You can see Market Capitalisation each day per the Mkt Cap ($M) column in WatchList Viewer, Stock Viewer or on the Graph. You will need to scroll across the columns as the default layout has this column as the third last column.
You can find the large Market Capitalization stocks that are breaking out in seconds using VectorVest. The technique I am going to cover is a technique I wrote about back on the 17th of November 2017 in the VectorVest Views which entailed Relative Timing (RT) multiplied by the Comfort Index (CI). This week, I want to revisit the power of RT x CI. RT is looking at the short-term price momentum of a stock and is purely a technical indicator. CI is also purely a technical indicator, but CI reflects a stock’s ability to resist severe and/or lengthy price declines. If you put the two indicators together by multiplying them and then sorting such that you have the stocks sorted by the highest combination of RT and CI, you will have some of the hottest stocks in those indices at your fingertips!
Be aware, however, you are simply looking at the technicals. Having said that, in a rising market, RT x CI can work very well (as we saw back in the views on the 17th of November 2017). Let’s look at the performance for 2019. How has RT x CI performed with our bigger Market Cap companies?
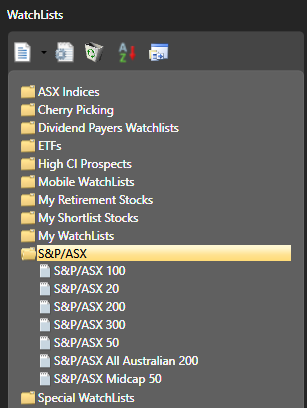
To do this, click on the Viewers tab, then WatchList Viewer. Under the the S&P/ASX Watchlist Group, you can find some of the key Indices listed. Click on the S&P/ASX 100 WatchList. This will open all the ASX100 stocks as of current date. Let’s set back the date to the start of the year: 2 January 2019. Next step, just above the date box, click on the box that has an up and down arrow and, from there, you can change the Primary Sort per the drop-down box. Click the drop-down arrow and then select RT * CI. Click on the radio button next to DESC and click OK. You will now have all the ASX 100 stocks sorted by RT x CI as of 2nd January. Now click on the dropdown arrow to the right of QuickTest and select Top 10 stocks. From 2 January 2019 through to 10 September, I got 27.86% (27.86) returns. This does not consider any dividend or Franking Credits. You can add another 3 to 4% returns to that figure to account for those. How do some of the other big indices stack up? I have run the numbers and here are the results, applying the RT x CI sort starting as of 2 January 2019 through to 10 September 2019:
S&P/ASX 100:27.86%
S&P/ASX 200:52.48%
S&P/ASX 300:44.88%
This analysis timed the market in terms of getting in for the start of the year, but there was no risk or money management rules in place. It was simply a buy and hold strategy. Nonetheless, it shows the power of those momentum stocks.
As of time of writing, our top 3 RT * CI stocks for the ASX 200 are as follows:
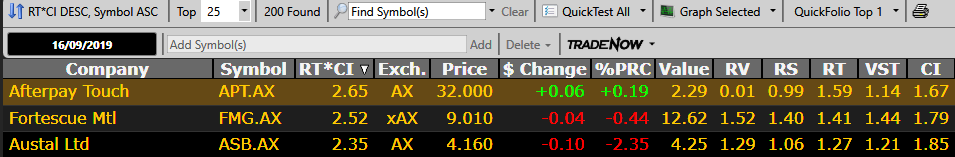
To our subscribers, per Views, per the WatchLists, open up the S&P ASX WatchLists to find all the top RT*CI stocks across the ASX 20, 50, 100, 200, 300, the Mid Cap 50 and the All Austrlaian 200 WatchLists!


Leave A Comment