
I recently came across several analyst articles showing their top dividend stock picks for 2018.
Some of the stocks mentioned were: AFI, ARF, AST, CHC, GNE, MEZ, MFG, MGG, NAB, QBE, SIG, SPK, SUN, TLS, WAM, WBC and WES.
I decided to analyse these stocks using VectorVest’s WatchList and Graph tools to see how they stacked up.
To do this yourself, click on the Viewers Tab on the main toolbar and move down the left-hand side of the screen to WatchLists. Then click on My WatchLists. With this group highlighted, click on the paper image with the top right corner bent down (just below the heading WatchLists) and set up a new WatchList called “Top Dividend Analyst Stocks for 2018” and click Add. You are now ready to enter the stocks above to this WatchList. Don’t forget to put in .AX after each symbol when entering Australian share ticker codes. In the box to the right of the date, type in the first symbol. For example, you would enter AFR as AFR.AX and then put in a comma to separate that stock from the next and then repeat the process until you have entered all the stock codes. Then press the Add button.

Setting up a new WatchList.
Click or tap image to enlarge.

Adding stock names to your WatchList.
Click or tap image to enlarge.
Let’s see what VectorVest tells us about this portfolio. We start by going to the WatchList Average Line (located at the bottom of this WatchList). You will see that this portfolio is overvalued, its potential to go up in value is fair with a Relative Value (RV) slightly less than 1 and the safety of this portfolio shown by its Relative Safety (RS) score of less than 1 is modest. If I scroll over to the Dividend Yield Column (to the right), I can see that as of 5 December 2017, the WatchList is yielding 5.29%. That is very good for this group of shares. But the column to the right, Dividend Safety (DS) has a score of 33 of a maximum of 99 which is not a particularly convincing score out. I prefer a score of at least 50. If I scroll over a little further to the IFC% (Interim Franking Credits %) and FFC% (Final Franking Credits %), I can see the percentages are 54.71% and 55.88%, respectively…hmmmmm…. I like to make full use of franking credits with my stocks fully franked (100% franking credits). You can look at these indicators for the individual shares as well.

The WatchList Average Line.
Click or tap to enlarge image.
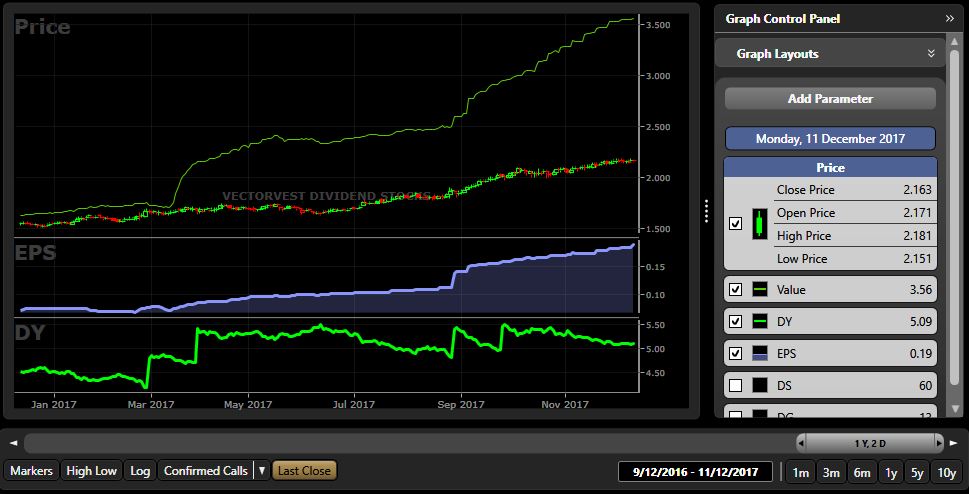
To complete the analysis, graph the WatchList Average Line. Right click anywhere on this line and select View WatchList Average Graph. Make sure you have ticked the Earning Per Share (EPS) and Dividend Safety (DS) boxes. If they are not shown in your layout, click on Add Parameter (just below the Graph Layouts heading at the top right of the screen). EPS is found under the Capital Appreciation group and DS is found under the Dividend Analysis Group. Once you have added these parameters and selected them on the graph, notice how the earnings are starting to fade and how DS has been falling since July 2017. A QuickTest of all the stocks in this WatchList (click QuickTest on the top of the WatchList page) from 3 January 2017 to 5 December 2017, shows a return of less than 1% (excluding dividends and franking credits). If we consider the dividends and franking credits, this WatchList returns roughly 8%.

WatchList Average Graph.
Click or tap image to enlarge.
We can do better using VectorVest to help us build our own Top Dividend Portfolio of safe dividend shares for 2018.
Set up a new WatchList called “VectorVest Top Dividend Stocks 2018.” Enter the following stocks AFG.AX, CVC.AX, DTL.AX, LYL.AX, NEC.AX, NHC.AX, PIC.AX and PMC.AX. The WatchList Average line shows that this group is undervalued. The portfolio VST is strong at 1.27. IFC% and FFC% are 100%. Dividend Yield (DY) is sitting at 4.93%, slightly lower than the previous portfolio, but adding our 100% franking credits, the overall dividend returns are almost identical. A graph of the WatchList Average Line shows a steady rising EPS and a strong rising DS score just under 60. A QuickTest of this WatchList from 3 January 2017 to 5 December 2017 shows a return of 37% capital gain and if we add fully franked dividends the total return is just over 44%. Why not go for a portfolio paying safe fully franked dividends with solid capital gains?
The lesson here is not to simply rely on the media and endless articles touting dividend stocks without checking them out using VectorVest. You will note that none of the stocks mentioned in the analyst reports made our VectorVest list of dividend stocks for 2018. Out of the two dividend portfolios above, I know which one I would rather go with!
How did I identify the second list of divided shares using VectorVest? In next week’s essay, I will show you exactly how I found these top 8 dividend stocks for my 2018 portfolio!
To find out more, take out a 30 day trial to VectorVest by clicking here
Written by: Robert and Russell Markham
DISCLAIMER: THE ABOVE ARTICLE DOES NOT CONSTITUTE FINANCIAL ADVICE. PAST PERFORMANCE IS NOT INDICATIVE OF FUTURE RESULTS. YOU SHOULD CONSULT WITH YOUR LEGAL, TAX, FINANCIAL, AND OTHER ADVISERS PRIOR TO MAKING ANY INVESTMENT.


Great article Russell, I have set up a Portfolio in vector vest to track this portfolio even closer. Will compare how it performs compared to a SMA I have in my super fund with the view to swap over down the track. One question I have, is volume a consideration in the Vector Vest Top Dividend Stocks? A couple appear to be lightly traded?
Hi Mark, thanks for your note. Volume was not a critical consideration, however it should be something seriously considered if one is investing a bit of money into a stock. As you rightly point out, there are 3 in there than can be a bit light at times. As a result, you can always leave those for now until volume picks up or exclude them altogether. I will look to revise this further based on volume – at least 5 of them will still make a volume consideration.
Regards, Russell.
Russell,
What criteria did you use to select your dividend stocks.
Thanks,
Graeme
Hi Graeme,
If you check the weekly essay in VectorVest views on the 15th of December – we provided all the details. Please find it listed here:
VECTORVEST DIVIDEND PICKS 2018 VS THE ANALYSTS: PART II.
Written by: Robert and Russell Markham
Last week we identified 8 dividend stocks for 2018 using VectorVest. This week I will show you exactly how I used VectorVest to find them.
Set up a new WatchList called “VectorVest Top Dividend Stocks 2018” (see 8 December’s essay for guidance on creating a WatchList). Note, if you have already set up this WatchList, give the new WatchList a different name. Do not add in any stocks to this WatchList at this point.
Below are the detailed steps to apply:
Step 1: Click on the UniSearch Tab on the main toolbar
Step 2: Create a new UniSearch by entering in the following parameters
DY >= 4, (click on a blank box in the Parameter column, select Stocks, then Dividend Analysis to find DY. Set the Operator to “>=” and then under the Value, select Custom Value, enter in 4. This will find stocks with a dividend yield of 4% or better)
DS >= 50, (click on a blank box in the Parameter column, select Stocks, then Dividend Analysis to find DS. Set the Operator to “>=” and then under the Value, select Custom Value, enter in 50. This will find stocks with a Dividend Safety of 50 or better on a scale of 0 to 99)
CI >= 1, (click on a blank box in the Parameter column, select Stocks, then Capital Appreciation to find CI. Set the Operator to “>=” and then under the Value, select Custom Value, enter in 1. This will find stocks with a Comfort Index of 1.00 or better on a scale of 0.00 to 2.00 – the higher the CI, the smoother the stock on average)
VST >= 1, (click on a blank box in the Parameter column, select Stocks, then Capital Appreciation to find VST. Set the Operator to “>=” and then under the Value, select Custom Value, enter in 1. This will find stocks with a VST of 1.00 or better. VST is our master indicator, combining Relative Value, Relative Safety and Relative Timing. It is on scale of 0.00 – 2.00. VST finds the best combinations of fundamentals and technicals)
IFC = 100, (click on a blank box in the Parameter column, select Stocks, then Dividend Analysis to find IFC%. Set the Operator no “=” and then under the Value, select Custom Value, enter in 100. This will ensure that any Interim Franking Credits are fully franked)
FFC = 100 (click on a blank box in the Parameter column, select Stocks, then Dividend Analysis to find FFC. Set the Operator to “=” and then under the Value, select Custom Value, enter in 100. This will ensure that any Final Franking Credits are fully franked)
Ensure the sort is by VST Descending (this should automatically be the default sort). You can find the sort parameter just to the right of the “Run Search” button.
Step 3: Click on Run Search as of 11 December
Step 4: Select all the stocks found. To do this, click on the first stock in the list and then scroll down to the last stock in the list, then hold down your shift key and select the last stock in the list. This will highlight all the stocks. Now right click your mouse and select “Add to Watchlist”
Step 5: Select the Watchlist you have already setup, “VectorVest Top Dividend Stocks 2018” (or whatever you have named it).
Step 6: Graph the list of 20 stocks and remove any stocks where the Earnings Per Share (EPS) is not currently moving up with a reasonable track record or where the stock Price has not been particularly convincing over the last 2 years. The stocks I weeded out as a result were: AVJ.AX, BWF.AX, CDM.AX, FSA.AX, IAG.AX, MRN.AX, MXI.AX, RIO.AX, SCO.AX, SGF.AX, TWD.AX, VLW.AX.
I must admit, SGF.AX has a great set of rising EPS and could have easily made the list. However, the share Price over the last 2 years was not convincing. TWD.AX was not too bad either, but the flat EPS for the last few months ruled it out.
The overall result as of 11 December 2017 is an impressive WatchList. The average share Price is $2.16 versus Value of $3.56 with a strong set of rising EPS. Dividend Yield as of 11 December stood at 4.91% with both IFC and FFC at 100% still to be added. Furthermore, the EPS is forecast to grow at 26% per year! In reviewing this WatchList for a second time, the only weakness I see is that CVC.AX does not have a high average daily volume, this may be a stock that could be removed for now from this list.
It must be remembered, that, when purchased, this is not a set and forget portfolio. It will need to be managed in accordance to market timing rules and risk money management.
If you would prefer not to go through the above exercise, simply refer to last week’s essay and set up the WatchList by adding the cited stocks.
Regards,
Russell.
Hi Russell
Great explanation for finding high DY portfolio which is what I am looking for
Three Q
1 I notice there were no exclusions on basis of RT < 1
2 What stops do you use?
3 How many shares have been sold and bought in this PF since Dec 2017
Thanks Jesse
At time of writing, the above stocks met very strict criteria. This was not a rules based trading system at that point – it was rather the top performing dividend paying stocks that met the criteria. You could take those stocks and put them into a watchlist and then setup a UniSearch such that just those stocks are picked. Then through BackTester you could then test the performance over a period of time. At the next Q&A I could look to do this. Per the stocks picked year to date, I see they are up over 3% excluding franking credits and dividends. Once rules are set for stop losses etc. I would expect those returns to be much higher.
Regards,
Russell.