AGL.AX AND ORG.AX.
Written by: Robert and Russell Markham
I had an interesting thought, what if I investigated the stocks that had performed well during the Global Financial Crisis (GFC) in Australia? And then, let’s see how those stocks have performed since the GFC and if we would still hold those stocks today. The stocks I am interested in are not penny stocks and they must be stocks that have good liquidity. For the screening of stocks, I am going to set the screening period to be 2 January 2008 through to 24 March 2009, when we got our Confirmed Up (C/Up) call as the market rebound took place. A very interesting premise indeed, but how am I going to do it? With VectorVest, this is easily done. I will walk through my process and the results:
Hop into UniSearch and create a new search. All we are going to do is screen for the following:
– Stock Price (Split Adjusted) >= 1.
– Stock AvgVol (50 day Moving Average Volume) >= 50,000
– Sort by the default – VST Desc.
Ensure that you are returning All Stocks (just above the TradeNow button, you can change the view to show all stocks, by clicking the dropdown next to Top). Set the date to 2 January 2008. Now click on Run Search. This will bring back all the stocks as of 2 January 2008 that meet the above noted criteria per UniSearch.
On 2 January 2008, your first stock should read Flight Centre (FLT.AX). Click on your first stock and hold down your shift key and scroll about one-third of the way down the list so that it is highlighted (we do this as we can QuickTest no more than 100 stocks at a time). Don’t try count this out, rather just approximate. You will now have a good chunk of stocks selected. Right click on the selected portion and click QuickTest. Ensure the date is set from 2 January 2008 through to 24 March 2009. With the QuickTest window open, sort the QuickTest by Total ARR in descending order. Jot down any stocks that have a positive ARR over that period. Repeat this process for the remaining stocks in the results list. These are the stocks that held up in the GFC!
I have done the quick exercise for you, here are some of the stocks that had a positive ARR in 2008 per the UniSearch criteria above:
AGL.AX, ARX.AX, ERA.AX, KCN.AX, MML.AX, NHC.AX, ORG.AX, OSH.AX, SOL.AX, STO.AX
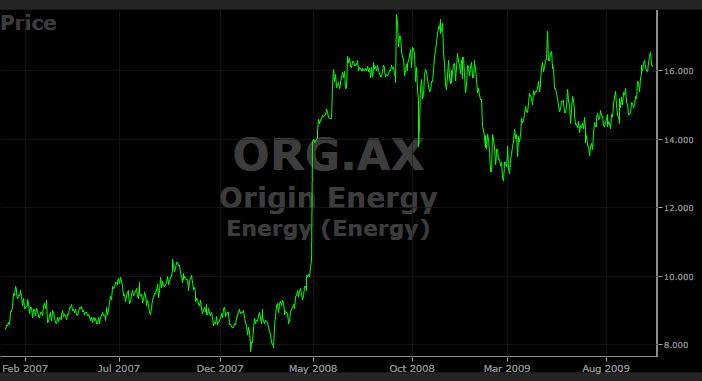
After having put these stocks into a WatchList, I was able to graph each stock for the 2008 through to 23 March 2009 period. I wanted to find stocks with the best left to right price patterns over that period. Only two stood out to me: AGL.AX and ORG.AX. Notice that these two stocks are in the Energy and Utilities industry. Could it be that these two stocks had customers that were contracted to keep paying their bills – like you and I? We didn’t turn our gas or lights off despite the GFC! Commercial contracts in the same boat? Sure, we may have been a bit more prudent with our power and gas etc. along with corporate account, but not significantly more than usual. Could that be the explanation? Whatever the exact reasons may have been, these two stocks stood out during the GFC.
Since 2 January 2008 ORG.AX has gone from $8.97 per share to $14.48 per share over the GFC time period and AGL.AX from $13.36 per share to $21.02 per share from the GFC through 12 June 2018. Neither of the stocks have had a stellar equity curves since 2008, but both stocks withstood the GFC. As of right now, ORG.AX is the pick of the two. It has a smooth rising equity curve as of May 2017 and smooth rising earnings along with rising technicals (RT).
DISCLAIMER: THE ABOVE ARTICLE DOES NOT CONSTITUTE FINANCIAL ADVICE. PAST PERFORMANCE IS NOT INDICATIVE OF FUTURE RESULTS. YOU SHOULD CONSULT WITH YOUR LEGAL, TAX, FINANCIAL, AND OTHER ADVISERS PRIOR TO MAKING ANY INVESTMENT.


Leave A Comment