
Written by Russell Markham and Rob Markham
The market is surging again! The Market Timing Indicator (MTI) had been slowly falling away and hitting lower and lower lows since last August…the MTI dipped below 1.00 on the 24th of September. As a result, many subscribers, myself included, were of the view that the market was headed down. But this was not to be the case.
Upon reflection, I made a key mistake! I was trying to predict the market. Don’t feel guilty if you did…it is human nature to try predict the market. In fact, investors have been doing this for years without much success on average. You will hear of the success stories no doubt, but rarely do you hear of the failures. My point is – let VectorVest guide you and do not let your emotions guide you. The MTI broke below 1.00 on 24th September and then broke back above 1.00, went back down to a score of 1.00 on 2nd October and from there…it has rocketed off (at 1.44 as of 13th October).
The MTI tells us whether the Underlying Trend of the market is up or down. A MTI score above 1.00 notes the Underlying Trend is up. A score below 1.00 notes the Underlying Trend is down. If you look at the MTI graph, since the 20th of May, the MTI has been above 1.00 apart from the 22nd of September (MTI at 1.00), the 24th of September (MTI at 0.99), the 25th of September (MTI at 1.00) and the 2nd of October (MTI at 1.00). If you put the Confirmed Signal onto your Market Timing Graph (just to the left of “Last Close” on your graph, you will see a dropdown key where you can select your given Market Timing signals. Per the drop down, select the Confirmed Calls as your Market Timing signal. The Confirmed Up signal (C/Up) was given on the 20th of May and has remained in place since then (I will show you how to do this in the video at the end of the Essay).
If you head over to the Viewers Tab, then click on Stock Viewer, this will load up all the stocks we track for Australia (over 1,970). Set the date back to the 20th of May and ensure the stocks are sorted by VST in descending order (this is the default sort). Then click on the QuickTest button and test the Top 10 stocks (by VST) from 20 May 2020 to 13 October, I see over 20% returns. Only 1 stock had negative returns and 9 stocks produced positive returns. Look an BBN.AX – it is up over 50% as is DTL.AX!
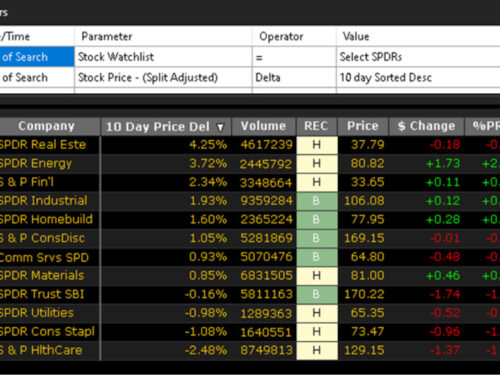
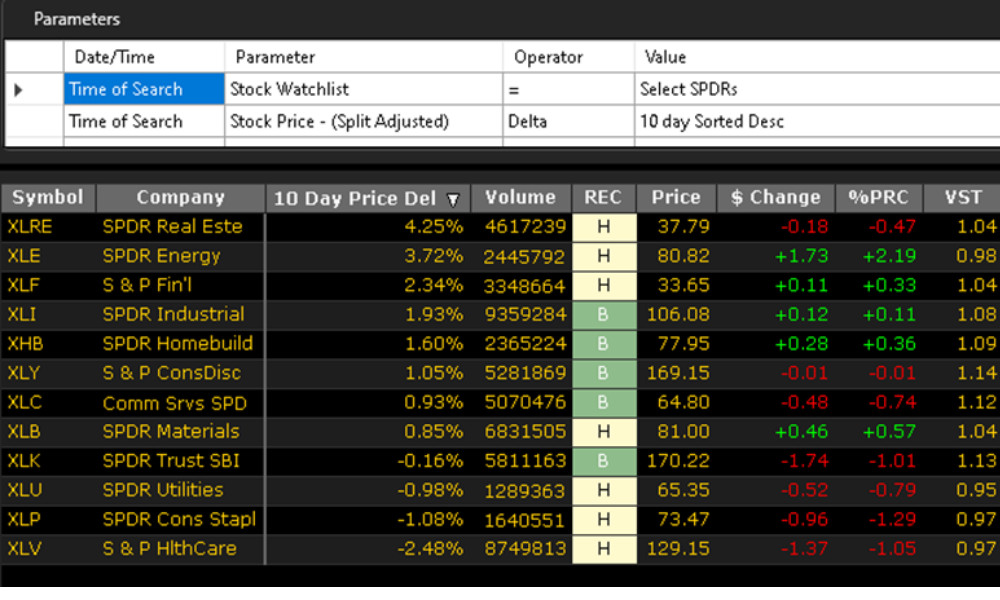
This got me thinking…what have been some of the best performing stocks since the Confirmed Up (C/Up) on 20 May? To find out…head over to the UniSearch tab. Open the Group called Delta Searches – Stocks. This Group houses some powerful searches that look for key defined changes that have taken place over a given time frame. You can customise them as required! Click on the Search entitled: 5-Week Price Delta. Set your date box (just to the right of RUN SEARCH) to read 20 May 2020. Click on: RUN SEARCH. As of 20 May, per the C/Up, the stocks producing some of the best returns going back 5 weeks are displayed. If you click on the QuickTest button (to the left of Graphs), you can set your QuickTest to Test the Top 10 stocks and you will see a return from 20 May 2020 to 13 October 2020 of over 95%. I will show you exactly how to do this all per the video below.
Now a few of you may be noting that a lot of the top performers were penny stocks. What returns would we have got with stocks at least $1 or better? Could we have done better? What if we add in further parameters such that the Earning Growth Rate (GRT) is at least 10% or better? There is so much you can do with the Delta Searches in VectorVest. CLICK HERE to see how we use the power of the Delta Searches to find great stocks in a rising market.


Russell, Could you advise me on Damstra Holdings DTC. I bought it on 09/10/2020 in a rising market, a rising stock and undervalued. It hasn’t done anything except go down!! Could you have a look at it and just tell me what I missed about it? Thanks Russell Gemma Bromham
Hi Gemma
The key driver here is market timing from what I can see. We got our confirmed Down (C/Dn) on the 29th of October. The market was starting to fall prior to this. Since you bought the stock, notice how the Relative Timing (RT) for the stock has been declining and now notice how the EPS has fallen away. This can happen, and as long as you have your risk and money management rules in play… it will ensure you do not give too much back to the market. Wait for the EPS to start pickign up again along with the RT for the stocks.
The good news is that the market is getting very close to a Confirmed Up signal which in turn could bring about a bit of a run on given stocks. However, DTC.AX has recently had a fall in the EPS indicator. We prefer to see stocks with a rising EPS. I can see as of time of writing that RT for DTC.AX is starting to pickup… and that bodes well for a technical rally… but from a fundamental perspective I want to see EPS continue to rise and not fall.
Please note, this is how I use VectorVest per above, I am not licensed to give advice. Please do speak to your financial professional for personal advice.