Hi everyone,
The user group challenge continues to power on – we have got through the first month. The competition ends at the end of November – so let’s have a look as to where we are currently.
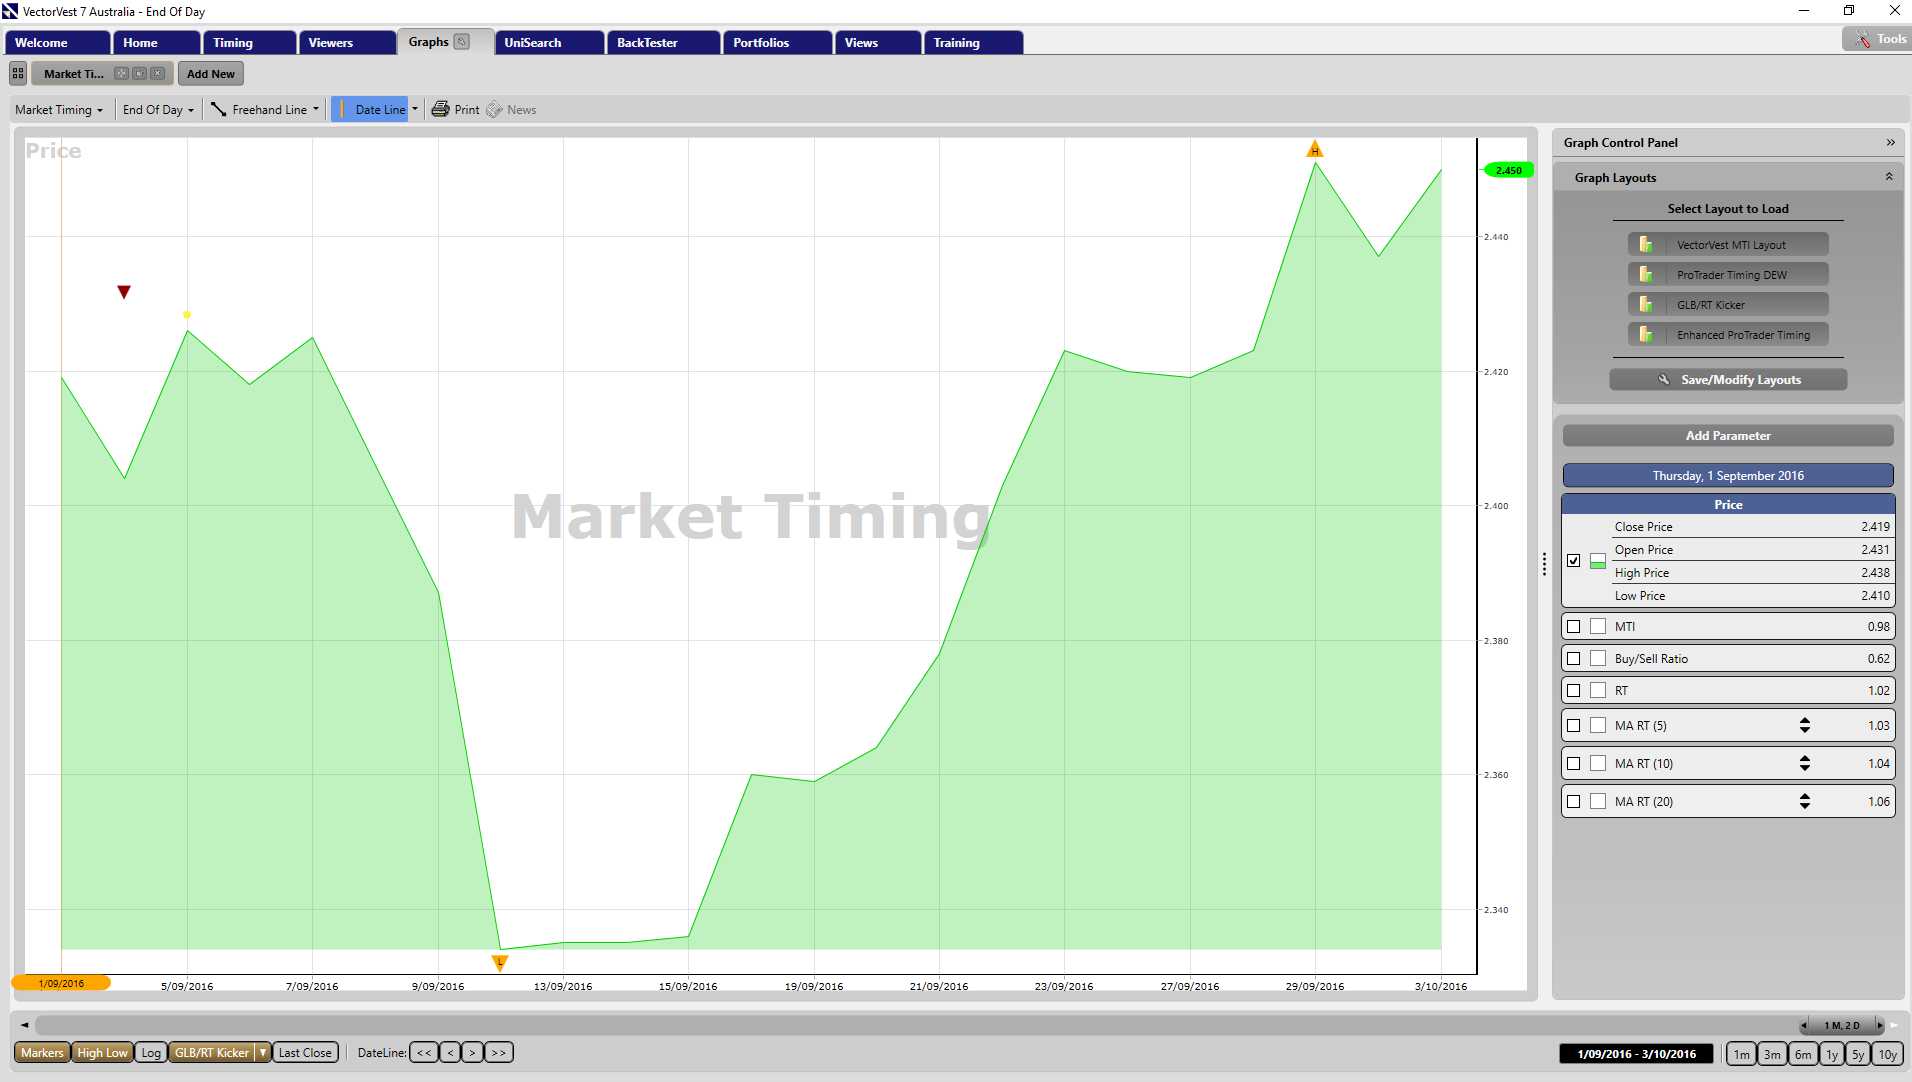
Before I do so – let’s look at the market since 1 September when the competition kicked off:
From 1 September – the market hasn’t moved up much -with some significant volatility. I certainly set you off in a testing market time period! Nothing like putting our portfolio skills through some volatility. Despite market swings, the power to build portfolios with strong CI, RS and RT (all on a scale of 0 – 2) scores certainly helps smooth out a porfolio. For those of you new to VectorVest, the CI indicator is a powerful proprietor indicator that helps identify stocks with the smoothest profiles. RS looks at the consistency and predictability of a companies financial performance and RT identifies shares that are moving the fastest to the upside. Here are the exact definitions (which can be accessed in VectorVest 7 by right clicking on any stock in stock viewer and selecting “View Full Stock Analysis Report”:
CI is an indicator which reflects a stock’s ability to resist sever and/or lengthy price declines.
RS is an indicator of risk. RS is computed from an analysis of the consistency and predictability of a company’s financial performance, debt to equity ratio, sales volume, business longevity, price volatility and other factors.
RT analyses a stock’s price trend. RT is computed from an analysis of the direction, magnitude, and dynamics of a stock’s price movements day-over-day, week-over-week, quarter-over-quarter and year-over-year. If a trend dissipates, RT will gravitate towards 1.00.
If you would like further details on the above indicators, click on the “Welcome” tab in VectorVest, then click on “Click here” in the top right corner – and from the next screen that is displayed – will have a link to “Stocks, Strategies and Common Sense” by our founder Dr. Bart DiLiddo. The relevant chapters are Chapter 7 and 11.
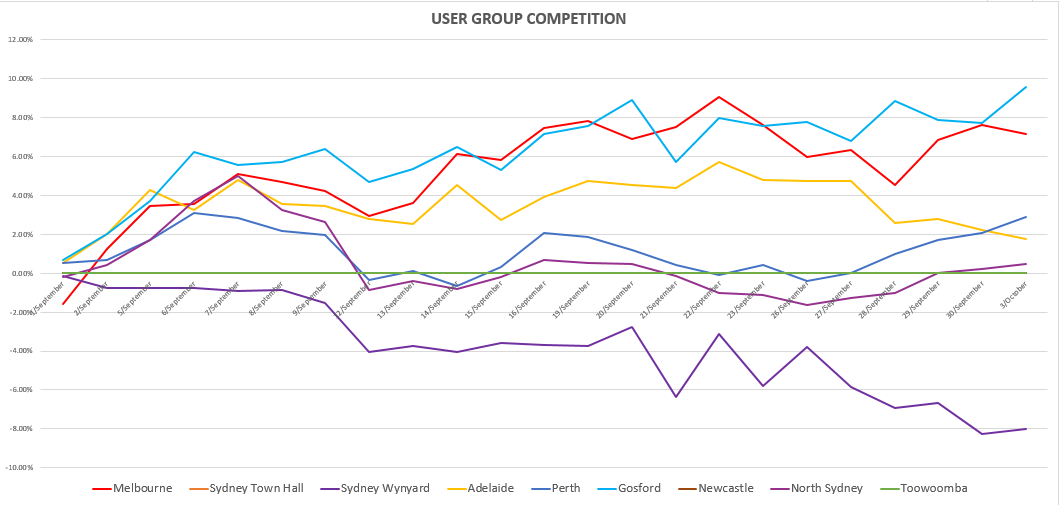
As of trading day 23 out of 65 – the top 3 performing portfolios currently are:
- Gosford: 9.55%
- Melbourne: 7.15%
- Perth: 2.90%
When exploring the top 3 portfolios currently, a common theme took place with these portfolios where RT, RS and CI are heavily in play.
For Melbourne – the UniSearch developed has applied the following sort: RT x CI. This ensures the fastest moving shares with the smoothest profiles are found. Certainly has had some great momentum considering the market conditions.
Gosford has applied the following sort: RV x RS X GRT x MC – where MC is Market Cap.
And for Perth, the sort applied is VST x RT – which effectively helps you screen for stocks with eh best combinations of fundamentals and technical (VST) that are moving up the quickest (RT).
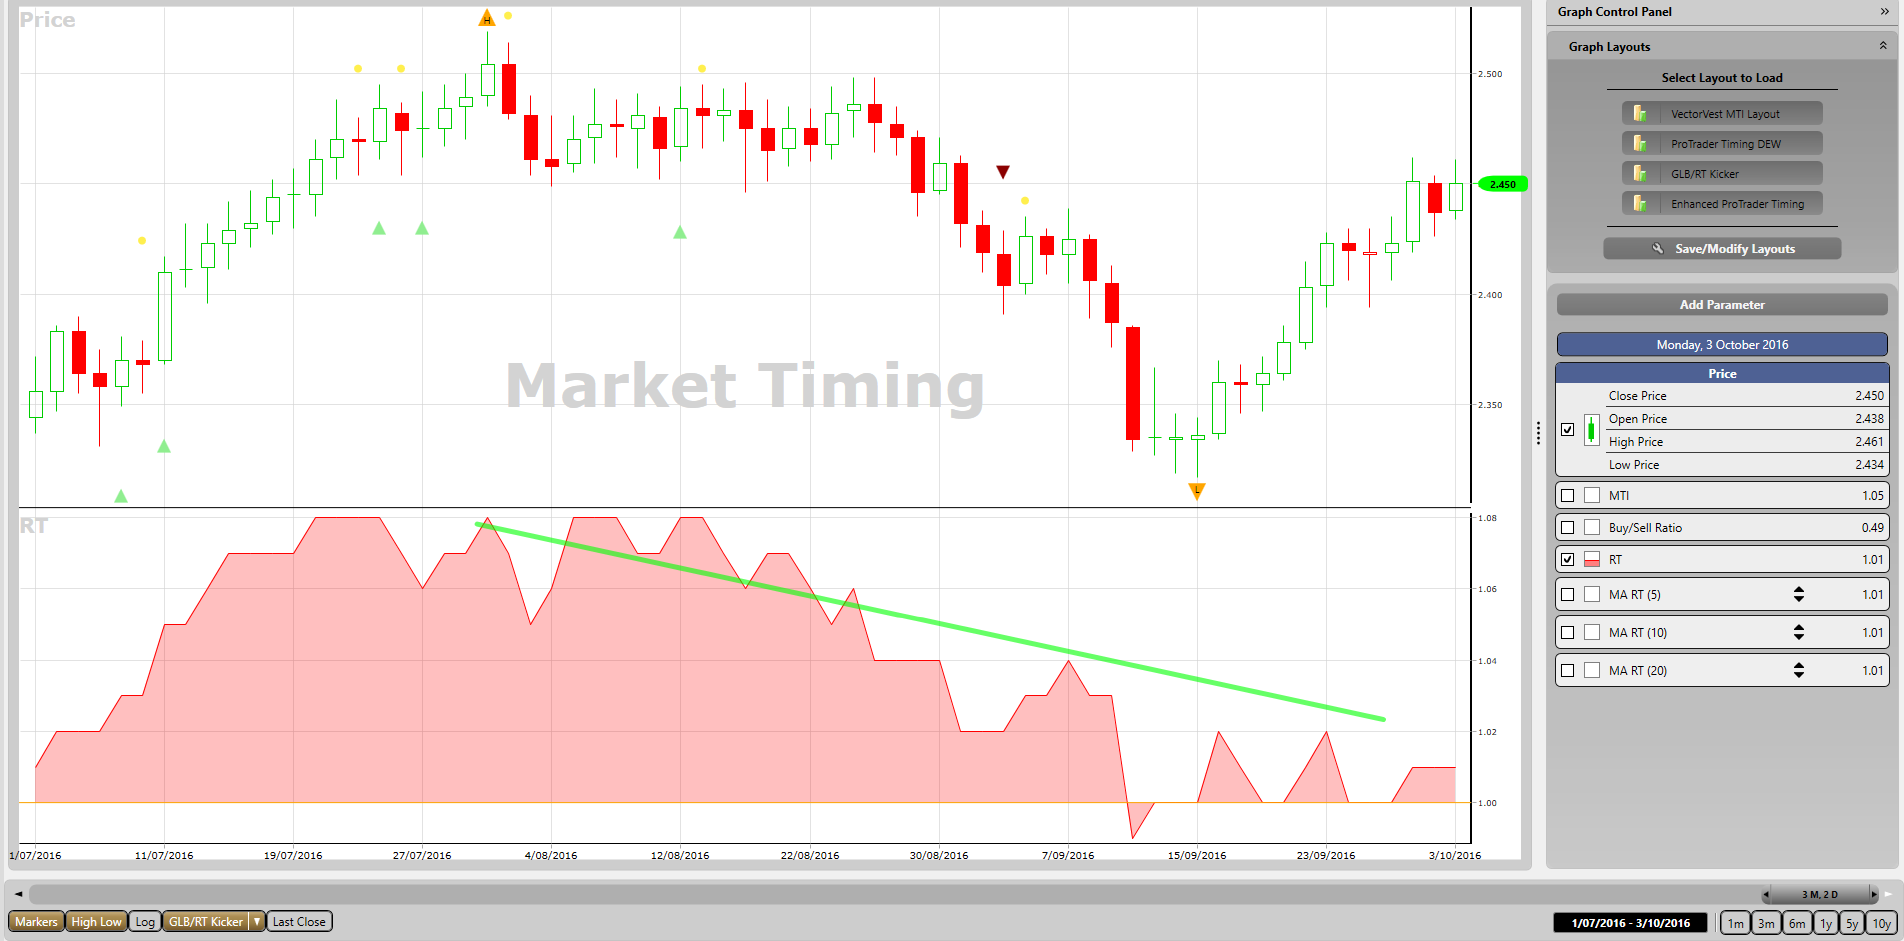
The only portfolio that has not been triggered yet is Sydney Town Hall – which applies the GLB/RT Kicker market timing signal. Per the graph below, GLB/RT Kicker is getting very close to providing a signal.
- Primary Wave
- Green Light Buyer
- GLB/RT Kicker
- DEW
- Confirmed Calls
In this phase of the market, GLB/RT Kicker has been slower at providing the entry signal than the DEW and the Confirmed Call – since the Relative Timing (RT) has been fairly flat – which in turn is not driving the crossover between the 5 Day Moving Average on RT (Green Line) versus the 10 Day Moving Average on RT (the grey line). For the GLB/RT Kicker signal to light up – we need the 5 day moving average on RT to cross above the 20 day moving average on RT and for their to be a green light in the price column of the colour guard.
For most investors in Asia Pacific, the confirmed signals (Confirmed Up or Confirmed Down) or the GLB/RT Kicker timing signal are the most popular. The GLB/RT Kicker signal is a powerful signal in determining market momentum – note above how the Relative Timing (RT) for the market has been hitting lower and lower highs. This is an early warning that the market is losing momentum. We saw this take place around 22 August – which in turn ensures we are kept on the right side of the market. No GLB/RT Kicker entry signal (green triangle pointing up) has taken place since 15 August.
If you would like to see the different market timing signals in a lot more detail, please check out:


Leave A Comment