KEEP YOUR EYE ON THE MTI AND RT.
Written by: Robert and Russell Markham
This was written per the VectorVest views as of 15 March 2019:
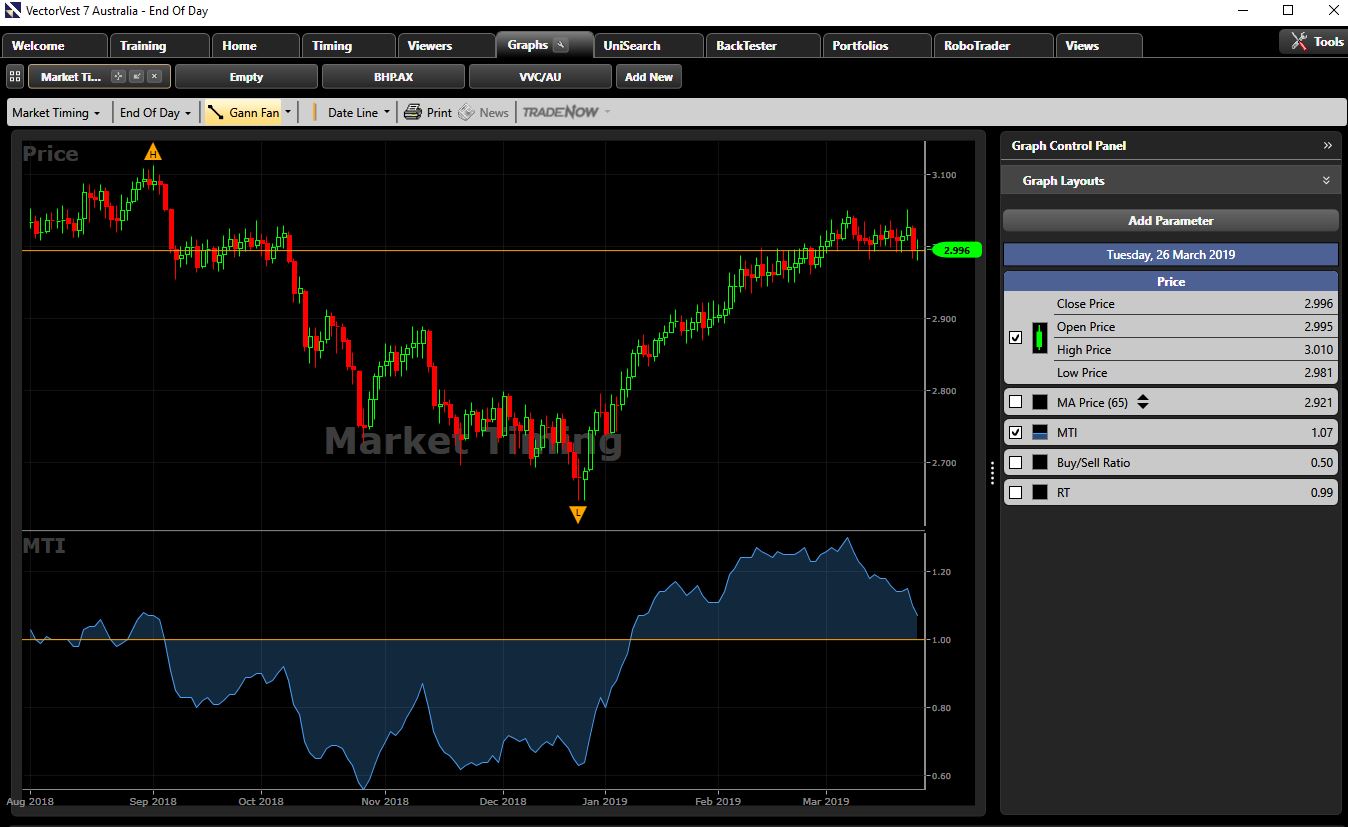
Has the market started to roll over? Does the recent explosive rally in the market have more legs to it yet? Click on the Timing Tab and click on the Market Timing Graph. This will bring up all the key indicators for the Market Timing Graph for Australia. The Market Timing Indicator (MTI), as of 12th March, has fallen from a high of 1.30 down to 1.21 and a downward trending short-term pattern has just started to develop. Have you noticed the recent pull back in MTI?
Note too that Relative Timing (RT) for the market has flat lined for now. In addition, the Buy to Sell Ratio (BSR) is falling away. All of this points to the market at present taking a breather. We cannot predict, rather we analyse what is in front of us. Right now, as it stands, the market is showing signs of slowing down. Could it simply just be a matter of catching its breath before the next move up?
Currently, we are still in a Confirmed Up, C/Up, situation. The last C/Up ran from 26 April 2018 through to 13 September 2018. If you look at the journey for the last C/Up, look closely to what the MTI did over this time. Did you see how the MTI gave us a fair bit of warning that things were slowing by mid-August 2018, leading to the Confirmed Down, C/Dn, signal? The MTI really started to break down by 6 September 2018 and not long after, the C/Dn took place.
Recall that for a C/Dn to take place, the MTI must have gone below 1.00 and the VVC/AU (the indexed average of all the stocks we track) must have decreased five-trading-day-period over five-trading-day-period for two consecutive five-trading-day-periods and from the prior day. If you are starting to see the MTI break down, and especially when the MTI goes below 1.00, chances are a C/Dn is not far off. So where does this leave us currently?
For now, the MTI is still well above 1.00. Chances are, the C/Dn could still be a while away yet. Time will tell. Keep your eye on the MTI for confirmation of the MTI breaking down and headed for below 1.00. In addition, keep an eye on RT. If RT starts to fall away and hits lower and lower lows, you want to pay closer attention to the market. For now, we will wait and see what unfolds. We are informed, we are armed with knowledge and we will not give away too much of our profits should the market fall away.
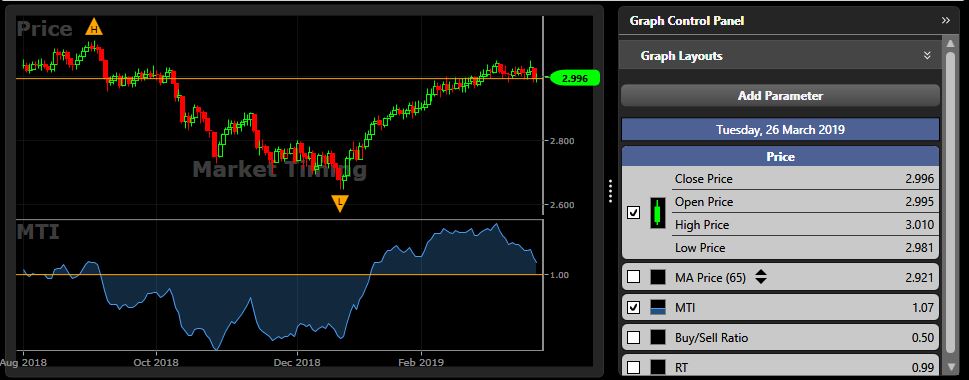
Update as of 26 March 2019:
Log into VectorVest and have at the current MTI graph… the MTI is getting close to breaking below 1. The power of VectorVest at work, keeping you informed, keeping you on the right side of the market!
Here is a snapshot as of 26/3/19


Leave A Comment