I wanted to share with you a wonderful feature in VectorVest which is often overlooked. This feature will help you find top paying dividend stocks!
Under watchlists (as found in the Viewers Tab) there is a watchlist called the Dividend Payers Watchlist. This can be found by opening up the group Dividend Payers Watchlist Group per screenshot below.
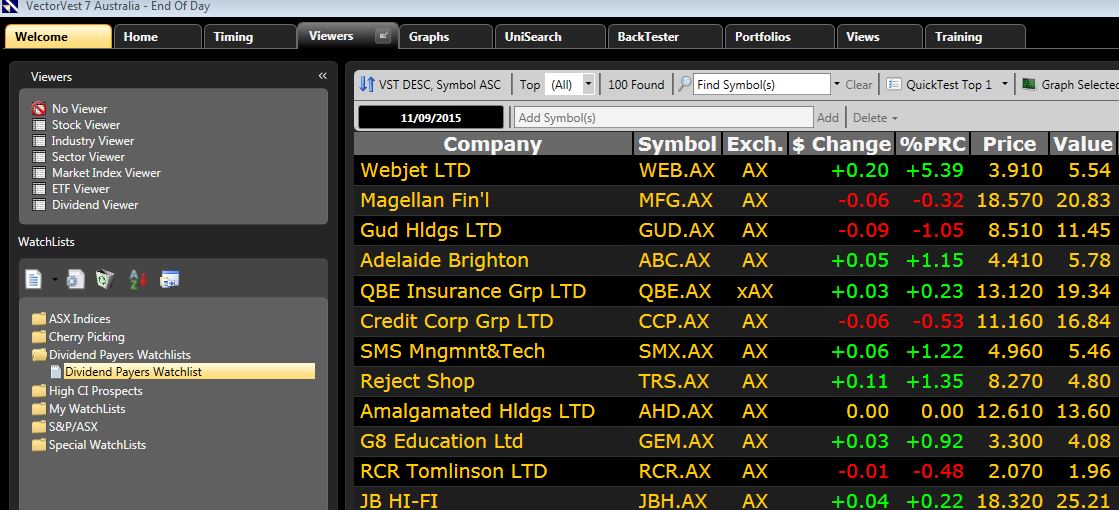
(Click on Image to enlarge)
This is a watchlist that we put together to capture stocks that have:
- Dividend Yields of 3% or better
- Stock prices of $2 or higher
- Have a final franking credit that is 100% franked
By doing this, we ensure there are no penny stocks, ensure solid dividend yield as well as franking credits.
In this watchlist, you can then pick and sort stocks according to your preferences – as no matter how you search or scan this watchlists – you know that the stocks that you select will meet the above mentioned minimum criteria.
By default – the list is sorted by VST – to ensure the best combinations of fundamental and technical is achieved. Then it is just a matter of checking though the list to ensure the top rated stocks meet further criteria.
For example, if you bring up the watchlists for the 11th of September – you will see that Webject is at the top of the list followed by Magellan Financial.
(Click on Image to enlarge)
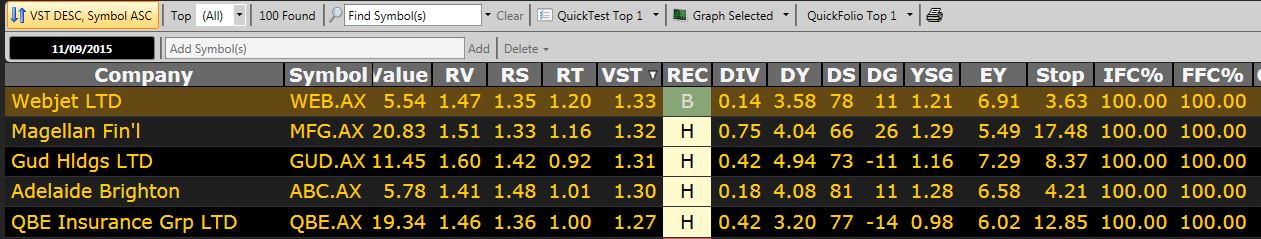
Once I have the Dividend Payers watchlist open – the first thing I like to do is to check the key dividend indicators.
The first indicator I like to check is the Dividend Yield Indicator. What yield am I going to get? I know it will be at least 3% – but I want to see how much higher than 3% it will be. A quick glance at the DY column notes a figure of 3.58%.
The next thing I like to check out is the Dividend Safety (DS) indicator. DS is on a scale of 0-99. This is an indicator of the assurance that regular cash dividends will be declared and paid at current or higher rates for the foreseeable future. Typically a stock with a DS of 75 (or higher) is very safe in terms of paying out dividends. High DS scores will typically be associated with companies that have sound financials and sufficient earning to pay out forecasted dividends. Webjet on 11 September noted 78. A strong dividend safety track record.
I then like to check the Dividend Growth (DG) column. DG is a forecasted annual growth rate of a company’s dividend based on historical dividend payments and dividend predictability. It also provides some insight into the boards outlook on the companys ability to increase earnings. A quick check of this column noted 12% – I like to ensure that if I am holding onto companies with dividends that are forecast to increase! DG provides a subtle yet important indication of a company’s financial performance. Think about it – companies that are likely to increase their dividends are most likely to be companies that are growing their earnings.
One last glance at the Dividend Payers Watchlists – I run my eye over the IFC% (the interim franking credit percentage) and FFC% (the final franking percentage) columns. I can verify that indeed Webject will be paying fully franked dividends – which in turn will ensure I can get the company tax paid on those dividends rebated back to me.

(Click on Image to enlarge)
In just a matter of seconds, I was able to ascertain that Webject has a very safe track record in paying out dividends of just over 3.5% and in addition – both the interim and final dividends are fully franked. Furthermore, I was able to see that the track record for Webjet is very solid in terms of meeting its dividend obligations and on track to keep growing the dividends.
Once I have checked out the key dividend indicators, the next step for me is to graph the stocks I like and check out the earnings profile. I want to ensure rising earnings – since earnings are the engine of price appreciation potential. In my example – Webject is showing a steadily rising earnings profile – a bit of volatility on this share – but looks to be on the up and up again. If I do not like the volatility – I am spoilt for choice – I just keep checking down my list. I check to see if I can get something a bit smoother in terms of price with just as good a dividend profile.
I graph some of the other stocks in the list on 11th of September – Adelaide Brighton – 4th from the top jumps out at me:

(Click on Image to enlarge)
It has smooth steady rising earnings – and a fairly resilient graph considering the market of 2015. This prompts me to investigate further.
I quickly determine that Adelaide Brighton is on track to pay out just over 4%(by checking the DY column), with a powerful DS of 81. The dividend growth outlook is 11% (DG) as of 11 September. In addition, the Interim and final franking credits are fully franked! I make note of this stock and continue on my search and continue on down the list…
This takes care of the dividend side of things. Once I have identified the top paying dividend stocks, I check the VST (Value, Safety and Timing) score – to ensure I have sound fundamental and technical. The VST score is on a scale of 0-2. The higher above 1 the better. I can see that Adelaide Brighton and Webject have strong VST scores of 1.33 and 1.30 respectively.
In just a matter of seconds, I was able to determine the key dividend indicators and ascertain whether I was buying into strong fundamental and technical companies.
On a final note – you can either start off by graphing the stocks to find the ones you like the profiles of – and then drill into the key dividend indicators. Or you can identify the stocks with the best dividend indicators and then graph them to make your final choice. Either way – you have the power at your finger tips to find top dividend paying stocks.
The Dividend Payers Watchlist certainly saves me a lot of time in screening top dividend paying stocks!
Regards,
Russell.
Disclaimer
This blog contains general information about VectorVest and related entities and is intended for informational purposes only. The information contained on this website is not an offer to sell or a solicitation of an offer to purchase interests in any stocks, nor does it constitute investment advice. .
PAST PERFORMANCE IS NOT INDICATIVE OF FUTURE RESULTS. YOU SHOULD CONSULT WITH YOUR LEGAL, TAX, FINANCIAL, AND OTHER ADVISORS PRIOR TO MAKING AN INVESTMENT WITH VECTORVEST


Nice post.!!