Thanks to everyone who gave me their feedback on the first cut of the growth portfolio – 10 share portfolio.
One common point of interest was how a growth portfolio stacked up over the GFC.
I went back to back-tester and ran the tests from 2007 through to present. After many tests, I am pleased to present the revised growth portfolio that holds up through the GFC:

The aim of this portfolio is to get the best returns but not at all costs. The returns are stacked up relative to:
- Drawdown
- Trades required
- Number of sectors invested in
- Number of industries invested in
- % of total stock volume purchased in a given day
The portfolio above ensures:
- Drawdown is kept to the 20% mark (20.27%)
- Trades are averaging 2 trades a month on average
- No more than 2 sectors picked up on average (out of 10 stocks)
- No more than 2 industries picked up on average (out of 10 stocks)
- No more than 5% of a stocks average volume picked up or sold on a given day
This portfolio seeks to maximise growth returns while doing so in a careful manner. The stop loss set is a 30% Gain, 15% Loss. As we have seen over the years in Australia – the wider ranging stop losses typically perform better than the tight stop losses. It helps reduce the number of trades – and improves the returns on average.
The revised portfolio makes use of a further refined UniSearch parameter set – where I have ensured no penny stocks are purchased, sufficient liquidity and stable price pattern (per our CI screening)

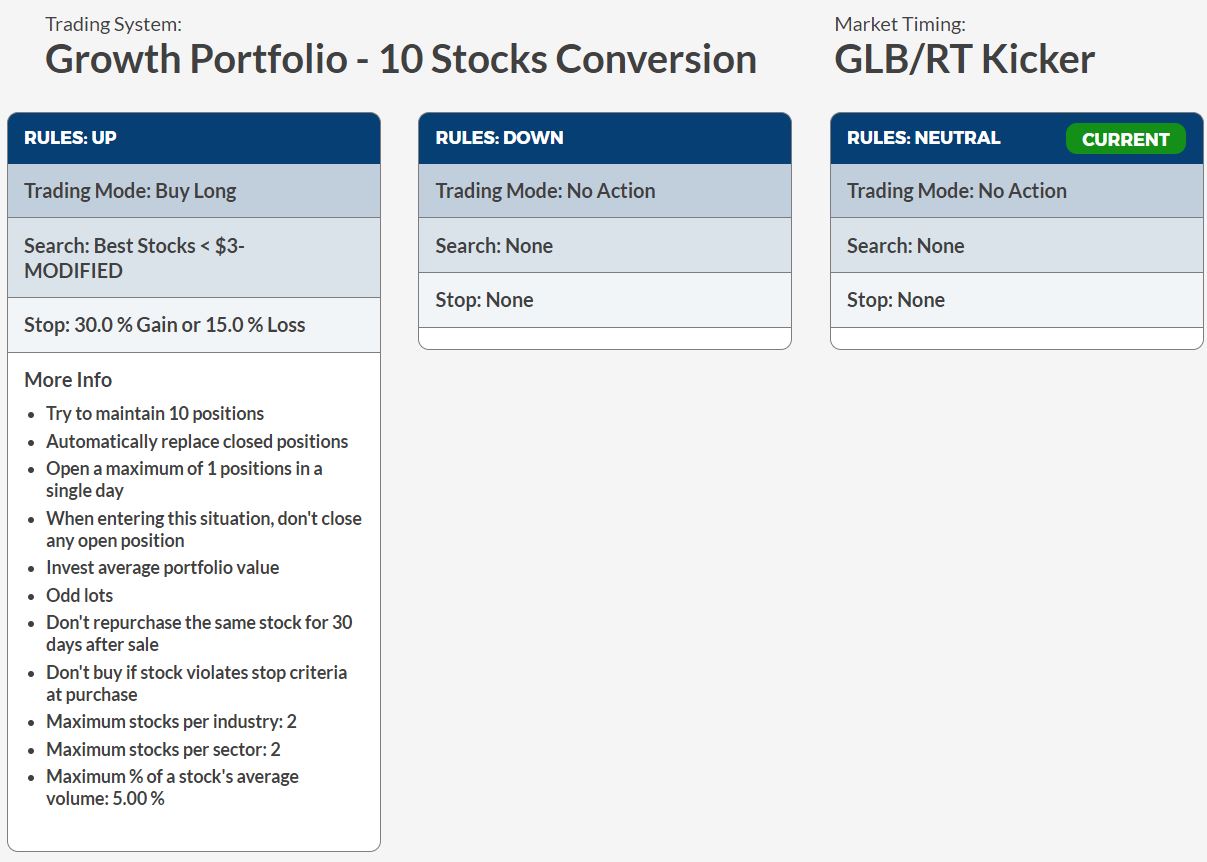
The settings for the portfolio is as follows:
 (click image to enlarge)
To see exactly how this portfolio is setup and further commentary behind this portfolio, Please Click Here to see the video.
Please note – the UniSearch is not currently loaded into VectorVest – and the portfolio is not currently in the system. However, per the video, you can quickly create the portfolio and track it until it is released.
Regards,
Russell.


Impressive!! The best strategy I could write could only handle 6-7 stocks. It’s barely got a pulse (minimal profit). This successfully spreads the risk across 10 stocks with a typical annual CROR of over 18%, drawdown of 6.25% and 48 transactions(Buys and Sells) using a one year period month by month walkback to January 2012. The best start months seem to be April, July and August. All of these findings ONLY relate to the first year of using the strategy. They have no bearing on the year on year performance (which is great). I have always found the first year of any strategy is where they break.
Thanks Stephen,
The great thing is that this is just the start. For those who want to take what I have and refine it further to suit their investment style and test it to ensure it all stacks up – all the more power to them. I have tried to refine it further – but the old saying – if it aint broke, don’t fix it – that is certainly applying here. It is running well – let’s keep an eye on it and see how it stacks up. Once I am satisfied – I will add this to the model portfolios in VectorVest! For me, the project was to go back right to the start of the data set and work on a solution that stood up well over that 10 year period. I was particularly pleased to see the performance in 2015. 2015 had some volatility. The portfolio did 23% with 9% draw down when the All Ords did -2.6%. It held up well in 2007 and 2008 as well.
Regards,
Russell.
With the search you wrote, there doesn’t appear to be any parameters limiting the stocks to industry group or sector? Is this covered off with the back testing?
The other point that I find with back testing, is a stock is selected for the portfolio if it is at the top of the Unisearch search. In real life if I use a search I manually sort through the top say 5 results and add to my portfolio the stock that I believe has the best graph which may not always at the top of the search. The results are not always as profitable. May be my emotions are getting in the way and I should just pick the top stock on the list returned by the Unisearch tool.
Hi Mark,
I limited the stocks to no more than 2 per industry and 2 per sector (not picking up more than 5% of its volume). This is fairly conservative for a 10 share portfolio. Under the heading: “The settings for the portfolio is as follows:” -the image directly below that heading has all the settings – click on the image and it will make it easier to see. The print is a bit small – but once you open up the image, you will see the exact settings a bit easier.
In terms of using a search – you can cherry pick stocks from a UniSearch – nothing wrong with that approach. It can bring about some great trades. However, for a trading system – we have kept a clinical approach where we have set the rules and applied them over and over again. I am certain that for some of the time had we cherry picked – we could have got better results – but for ease of testing we kept it to the top find in UniSearch. We are only buying 1 stock in at a time – so only the top stock per the Search found on each occasion (unless it was already held – in that case the 2nd ranked stock would be picked and so on…)
Regards,
Russell
Amazing! I carried out some additional testing and can say this does work well in the Aussie market. Out of curiosity I back test the same methodology on US market and got even better results! I was really surprised to see Explosive stock searches works well in both markets. I couldn’t resist and also back test in UK market but found this terrible. In the trading plan I tried all sorts of tweaks but couldnt start any sparks to get the portfolio to grow. Great work!
Thanks Chris. Yes, the Mid-cap type stocks in the US and Australia markets are interesting to watch. They tend to really rocket off market bottoms – and if you control the timing along with fundamentals and technicals (through controlled risk management) – you can make some great returns. One of the key challenges on this portfolio for myself was setting the stop loss. Too tight – it strangled the returns and did too many trades – and too lax a stop loss – the volatility became an issue. Where it is set per the many back-tests – I feel this has proven itself for now. Regards, Russell.
This was a useful post and I think it is rather easy to see from the other comments as well that this post is well written and useful. I bookmarked this blog a while ago because of the useful content and I am never being disappointed. Keep up the good work.
Many thanks Kerry. The 10 Stock Model Portfolio has really preformed very well this year so far. All the preparation with the backtesting to perfect this portfolio last year has been well worth it! Thank-you AutoTimer! Some of the top performing stocks in this portfolio so far this year have been OMH.AX, (closed out for 29.45%) CLV.AX, (closed out for 25.22%) SAR.AX, (up over 18% to date) BPT.AX (up over 13) and NEC.AX (up over 10%). Regards, Russell.