KEEPING IT SIMPLE WITH VECTORVEST!
Written by: Robert and Russell Markham
Once you get to grips with VectorVest, you should not have to spend much more than a few minutes a day in the system. With the mobile app for both the Apple iPhone and Android, keeping on top of your portfolio is quick and easier than ever before.
What about a really easy way to manage some cherry-picked stocks? Here is a great process you can consider:
Step 1: Check Market Timing – wait for the Confirmed-Up signal to take place
Step 2: Identify stocks with smooth left to right price patterns along with consistent rising earnings
Step 3: Put the stocks identified into a WatchList
Step 4: Manage your stocks applying Dr. DiLiddo’s 4 Steps to Protecting Profits
Let me elaborate further on the steps:
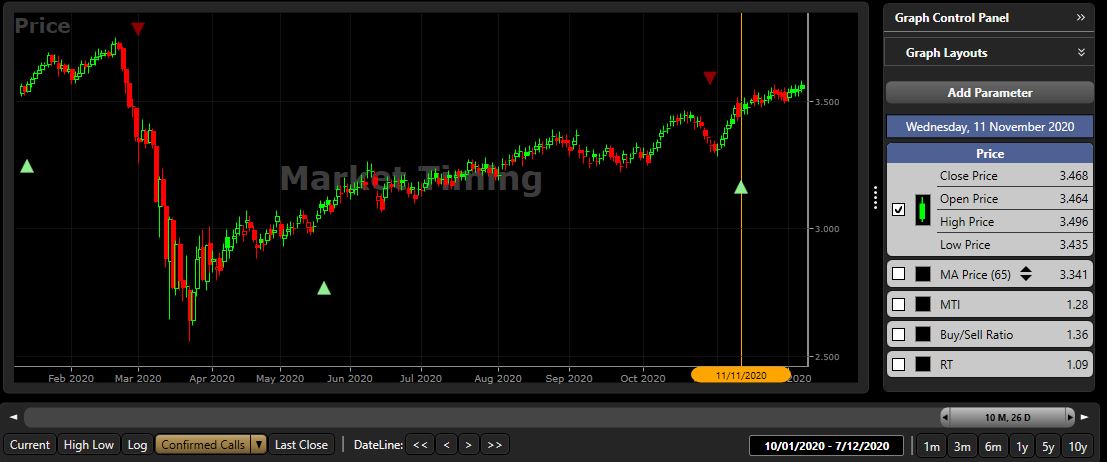
Step 1: Go to the Market Timing Graph. The quickest way is to click on the Timing tab and then click on Market Timing. Per the Market Timing Graph, wait for your preferred market entry signal to take place. At the bottom of the graph, to the left of “Last Close” there is a dropdown menu where you can change the signals to overlay on the graph. I would suggest starting off with our most conservative Market Timing signal: Confirmed Calls. Wait for the Confirmed Up, C/Up, to take place. The last C/Up took place on 11 November 2020. I will run with 11 November in this example.

Step 2: Go to Stock Viewer by clicking on Viewers, then Stock Viewer and use the calendar to select 11 November 2020. Ensure the list is sorted by VST in descending order (this is the default layout). Graph the top 20 stocks (you can select less or more if you wish depending on how many stocks you are after). Identify the stocks with the best left to right price patterns along with the best earnings profiles (EPS). You want both to be trending up as smooth as possible from left to right. For this exercise, ignore any data after 20 November 2020 since you would not have had that information! How far back should you graph the stocks? I pulled the graph back about 18 months, I wanted to see what was working leading up to 20 November.
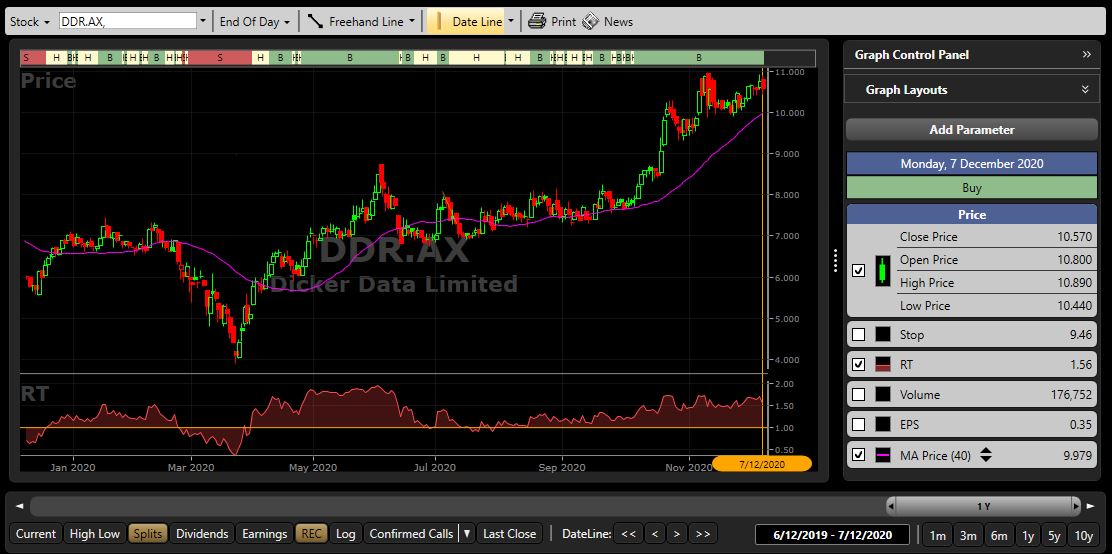
For the exercise, the stocks that jumped out to me on 20 November: DDR.AX, MIN.AX and FMG.AX. You could also have considered XRO.AX as it had a rising share price and rising earnings. Would you have picked these stocks based on the historical graph up to 11 November 2020? What would your list have been?

Step 3: Put those shares into a WatchList. If you need any help on this step, check out the Welcome tab in VectorVest, the Build a WatchList Tutorial will help you get this done in minutes. At this point you can consider purchasing or paper trading.
Step 4: Apply Dr. DiLiddo’s 4 Steps to Protecting Profits. Here are the 4 Steps:
Step 1: Look for your stock price falling away and for volatility
Step 2: Price falls below the 40-Day Moving Average (MA)
Step 3: Relative Timing (RT) drops below 1.00
Step 4: REC = Sell

Assuming he had bought the top 4 stocks identified on 11 November, as of 7 December 2020:
DDR.AX – You would still be in this stock (up over 1%)
MIN.AX: – You would still be in this stock (up over 26%)
FMG.AX: – You would still be in this stock (up over 19%)
XRO.AX: – You would still be in this stock (up over 12%)
Notice per the above list, none of these stocks were penny stocks. All these stocks had good volume as of time of buying.
We have put a video together for this for you to see how easy this is to do. CLICK HERE to see the video.
DISCLAIMER: THE ABOVE ARTICLE DOES NOT CONSTITUTE FINANCIAL ADVICE. PAST PERFORMANCE IS NOT INDICATIVE OF FUTURE RESULTS. YOU SHOULD CONSULT WITH YOUR LEGAL, TAX, FINANCIAL, AND OTHER ADVISERS PRIOR TO MAKING ANY INVESTMENT


Leave A Comment