Hi everyone,
I had a request to run the 10 Stock Growth Portfolio settings on some of key international markets we track.
It was interesting to see that this stacked up well in the US and Canada. The US market has had a significant run since 2009 – which in turn helped drive the parameters that have worked so well in Australia.
For Canada – the Canadian market is somewhat similar to Australia – with a good sprinkling of mining stocks. In terms of total size of the world stock market – the USA accounts for 53.2% , Canada at 2.9% and Australia accounting for 2.5% as of 2016 (https://www.bloomberg.com/view/articles/2017-03-17/think-global-to-avoid-shrinking-u-s-stock-market)
I got to work testing the exact settings for our 10 Stock Growth Portfolio against several countries. Very interesting. The USA and Canada worked fairly well applying the same settings.
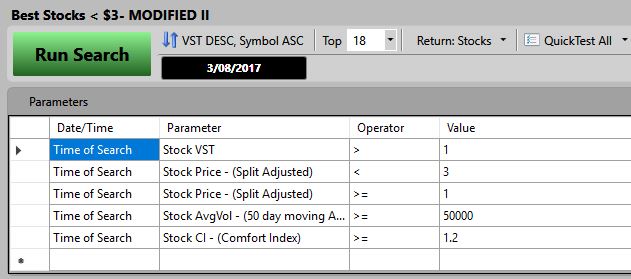
I made one variation to the 10 Stock Portfolio – it has not affected any of the results or back-tests in Australia – but it was prudent to ensure that I kept the parameters consistent – I changed the parameter relating to finding stocks no more than $3. Originally I had one of the line settings in UniSearch as: Stock Price (Actual) < $3. I have changed this to note: Stock Price (Split Adjusted) <$3.
It is always best to work with a split price adjustment. If stock splits take place – this can cause results to be inaccurate since an actual price is not adjusted for the stock split until it has taken place and not adjusted prior.
In the UniSearch settings, I changed the parameters to read as follows:
To see the international BackTests, please CLICK HERE
Regards,
Russell.


Russell, Interesting post on the 10 stock growth portfolio and how it stacks up overseas. Isnt it the case that individual stocks are generally more expensive in the US than in Australia (ie fewer shares issued per company). As such, it would be interesting to increase the lower and upper price criteria in the US version of the search, and see what that does to return and drawdown. (I tried to find information on the distribution of share prices in Australia and the US, but wasnt successful, all the returned results are price vs time).
Thanks, Ed
Thanks Ed,
Yes, certainly we can adjust the parameters accordingly. With just on 10,000 stocks in the US – it certainly is a market where it has a stock for just about any requirement. We can certainly tweak the settings and check out the result accordingly. In VectorVest US – the 5 model portfolios currently in the system are performing exceptionally well – that is probably the best place to get ideas for now – since these portfolios have been put through a lot of scrutiny. Excellent results year to date with those portfolios. I will get onto some further stress testing next week and drop my post in to the blog. Regards, Russell.
Hi Ed,
I increased the parameters on the price settings – and set it to be Price (Split adjusted) >= 0.5 for the lower range and for the upper range – Price (Split adjusted) <= $10 I ran a few more iterations and did not find anything too significant. This was interesting as it shows that the power is in the high CI indicator parameter, the market timing and risk money management rules. This kept the portfolio ticking along nicely - and when opened up to higher and lower priced stocks - it did not cause any significant disruption. Regards, Russell.