By Leslie N. Masonson, MBA
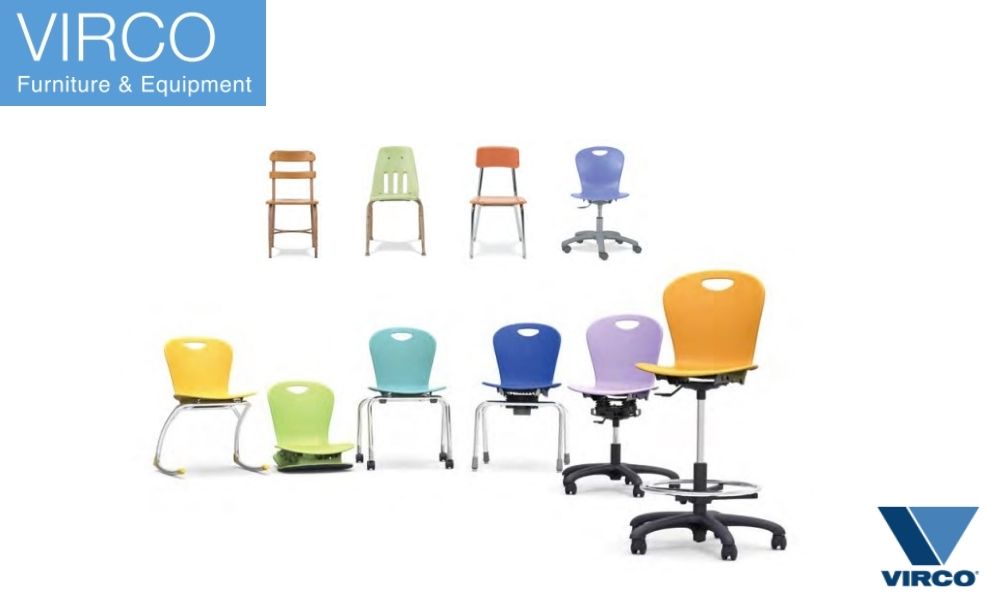
Virco Mfg. Corp (VIRC) is a Nasdaq-listed firm headquartered and incorporated in Torrance, California in 1950 with 800 employees. The company’s main business produces, designs and sells its wide array of furniture in the United States, including specialty chairs and stools, rockers, stacked chairs and ergonomic seats. Moreover, it offers a separate line of office productivity equipment, workstations, tablets, desks and credenzas, as well executive-level office furniture and cabinets. Their client base is both private and public schools, colleges, convention centers and governmental offices, among others.
Currently, the company has 16 million shares outstanding. VIRC has reported trailing 12-month revenues of $258 million. Its market capitalization stands at $108 million, and it pays no dividend. Over the past 5 years its 33.7% net income growth rate compares very favorably to the 9.1% average rate of the industry. The stock is classified as a consumer cyclical in the furniture business.
VIRC caught my attention on Wednesday, October 11 while I was scanning the Stock Viewer, as it was the fourth-ranked stock in the entire VectorVest 9,166 stock universe, and it was the only furniture company listed in the top 100 ranked stocks.
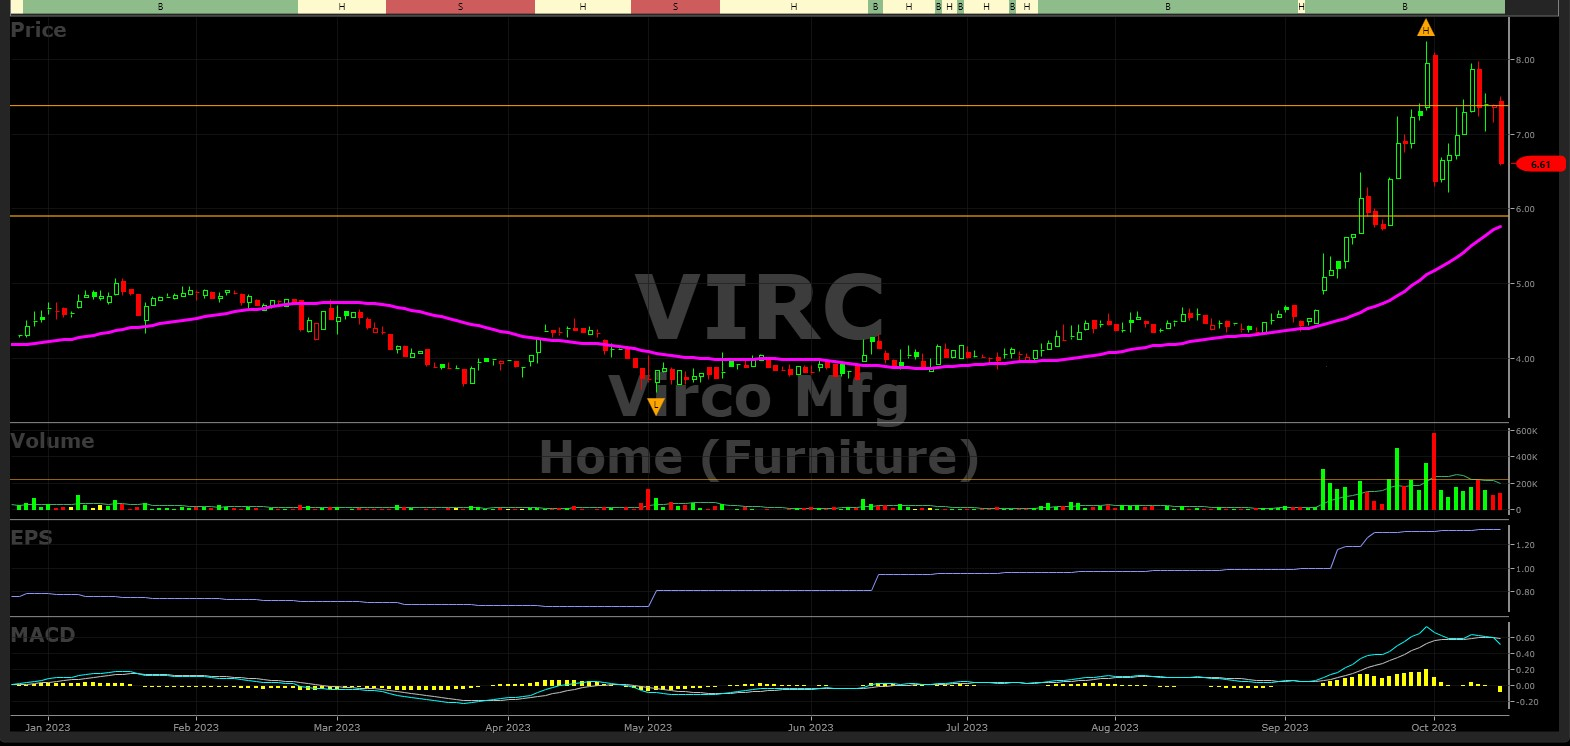
In particular, I noticed its low price ($7.41) and its high VectorVest rankings, so I investigated further. But, by Friday, October 12, it closed at $6.54, cratering 11.1% for the day, but not on excessive volume. Note on the chart below, the wild price movement the last 10 days, and the large jump on September 11 after their positive earnings release.
Friday’s action was probably profit taking, similar to October 2 when it plummeted from $8.00 to $6.36 before working its way higher over the next five days before giving back 80% of that gain.
Its 2022 to 2023 price range is $2.63 (April 28, 2022 low) to $8.24 (high on September 29) for a gain of 213%. It is unusual for any low-priced stock to have such a high VectorVest ranking. Furthermore, there were only five stocks out of the top 100 VST-ranked stocks that are priced under $6.
Again, looking at the chart below, you can see the stock rocket higher after September 11 with a large increase in daily volume which is still the case. As more interest is shown in the stock, the price should be able to move higher.
Most investors and institutions are not familiar with this small-cap firm. It has only gained the attention of eleven institutional investors, which is a minuscule following. Collectively, these firms own a mediocre 27% of the outstanding shares, while insiders hold only 15% stake. Either of these numbers is impressive in any way.
Vanguard owns 0.92%, while Dimensional Fund Advisors owns 2.4%. Moreover, only one analyst is covering the stock. Clearly, institutional following and interest is almost non-existent.
VIRC is situated in VectorVest’s Home (Furniture) category and holds the #1 VST position among 15 companies. Furthermore, it also maintains the #1 position in the broader Home sector, which comprises 39 stocks. This is particularly noteworthy, considering that the group itself is ranked #12 in Relative Timing (RT) out of 222 tracked industries, signifying a well above-average ranking. It is always beneficial to find a stock in an industry group that is in the top 10% of all industries, as stocks in a group tend to move together like the phrase “birds of a feather clock together”. A stock that is significantly outperforming its group, like VIRC, needs to be carefully investigated to determine if it is a potential “Buy”candidate.. Therefore, let’s check out its VectorVest metrics.
Virco Mfg. Offers Very Good Metrics, Is Undervalued by 46% and Making New Highs Over the Past Month
The VectorVest software issues buy, sell, or hold recommendations on 9,166 stocks/ETFs. This proprietary stock rating system splits the data into three simple ratings: relative value (RV), relative safety (RS), and relative timing (RT). Each is measured on a scale of 0.00-2.00, with 1.00 being the average for quick and easy interpretation, and 2.00 being the best.
As for VIRC, its current metrics are as follows:
- Excellent Upside Potential: The Relative Value (RV) rating focuses on the stock’s long-term, three-year price appreciation potential. VIRC currently holds an RV rating of 1.54, which is exceptionally high. The current stock price is $6.61, and VectorVest places its value at $9.70, indicating that the stock is considerably undervalued with a significant upside potential of 46.3%.
- Fair Safety: The Relative Safety (RS) rating is based on the company’s business longevity, financial predictability/consistency, debt-to-equity ratio, and additional risk parameters, including price volatility. Its RS rating of 0.95 is below average, which makes it unsuitable for conservative investors.
- Excellent Timing: The Relative Timing (RT) rating focuses on the price trend over the short, medium, and long term. The components include price direction, dynamics, and price magnitude of price changes over daily, weekly, quarterly, and yearly comparisons. VIRC boasts an exceptionally high RT rating of 1.86, well above the database average of 0.79. This indicates that the stock has consistently outperformed across various timeframes.
- Fair Comfort Index: This index measures the consistency of a stock’s long-term resistance to severe and lengthy corrections. This index compares the individual stock to the fluctuation of the VectorVest Composite price. VIRC’s rating of 1.07 is slightly above average. This reading also indicates that it would not be suitable for conservative investors, as was the Safety Rating above.
- Excellent Growth Rate (GRT): VIRC’s current sales growth rate over the past 12 months has been a rather bountiful 30%, with an exceptional forward-looking earnings growth rate of 38% (measured over a forecasted three-year period). These two factors, among many others, are captured by the VectorVest software. Therefore, you can quickly get a picture of the company’s fundamental measurements with a few mouse clicks.
- Very Good VST Score: The VST Master Indicator ranks all stocks from high to low with those stocks with the highest VST scores at the top of the list. VIRC’s VST is 1.52, which is well above average. The VST enables subscribers to quickly identify stocks that are performing much better or worse than the average, and VIRC is clearly a top performer. Note that the VST on October 11 was 1.48 so it has fallen from 4th place on the Stock Viewer to 68th place this past Friday due to its recent tumble.
Conclusion
For the past few weeks, the price has been in a trading range of $6.36 to $8.09. The previous high was $5.90 on September 15, 2017, so its recent surge took out that high with a vengeance. The downswing on Friday of over 11% needs to be regained for the stock to continue its march higher.
Virco Mfg. strong metrics, including its recent rapid price acceleration since September 11, indicate a high potential to continue reaching new all-time highs. A break below a price of $6.36 would suggest that the trend has reversed lower, and any potential purchase delayed until the price rises well above that level again.
The earnings trend is on an upward trajectory, and the average daily trading volume of 108,000 shares provides sufficient liquidity. Please note that there is a wide bid-ask spread of between 2% to 3%. However, this is common for lower-priced stocks with less than one million shares traded daily.
If you decide to purchase this stock, at the appropriate time, consider using a price limit order between the bid and ask prices to get a better execution. Otherwise, you may be vulnerable to exploitation by market makers.
Avoid chasing this stock. Wait to see if the stock consolidates further, and consider a position only if it takes out the current high of $8.24, make sure that it is still on a “buy” signal, and the Daily Color Guard is on a Confirmed Buy signal. If you use that timer. At this time, consider placing this stock on your watchlist patiently waiting for the most logical and high probability entry point.
If you're not a VectorVest subscriber, consider the $9.95 30-day trial to track the stock’s price movements along with the VectorVest signals.


Want These Types of Insights at Your Fingertips so You Can Win More Trades?
Use VectorVest to analyze any stock free. VectorVest is the only stock analysis tool and portfolio management system that analyzes, ranks and graphs over 18,000 stocks each day for value, safety, and timing and gives a clear buy, sell or hold rating on every stock, every day.
Before you invest, check VectorVest! Click here to ANALYZE ANY STOCK FREE and see our system in action!


Leave A Comment