
CarMax (KMX) reported fiscal second-quarter earnings that narrowly exceeded analyst expectations but spoke to a more grave concern of the used car market in general. The stock has fallen more than 9% in Thursday’s trading session as a result.
Sales dropped from $8.145 billion this time last year to just $7.074 billion for the second quarter this year. Despite taking a step back CarMax still outperformed the FactSet consensus of $7.024 billion.
Profitability suffered as well with a net income of $118.6 million compared to $125.9 million last year. The EPS of 75 cents per share was a slight step backward as well but matched the FactSet consensus.
The lackluster quarter can be attributed to a softening used vehicle market. Both wholesale and retail sales slowed for the quarter ended August 31st. The only positive news was growth in online retail sales, which accounted for 14% of total retail sales and signified an 11% growth year over year.
CEO Bill Nash did his best to show optimism on the earnings call, saying that despite the widespread pressures across the industry the company is still driving sequential improvements. But, the stock has lost about half its market cap since reaching a high of more than $134/share in October of 2021.
That being said, KMX has climbed more than 30% so far this year, dramatically outpacing the S&P 500 index. So, is this just another minor bump in the road as the company works back towards its 2021 highs? Or, is it officially time to cut losses on this stock?
We’ve analyzed KMX through the VectorVest stock analysis software and uncovered 3 things you need to see before doing anything else – whether you’re currently invested in the stock or are considering trading it.
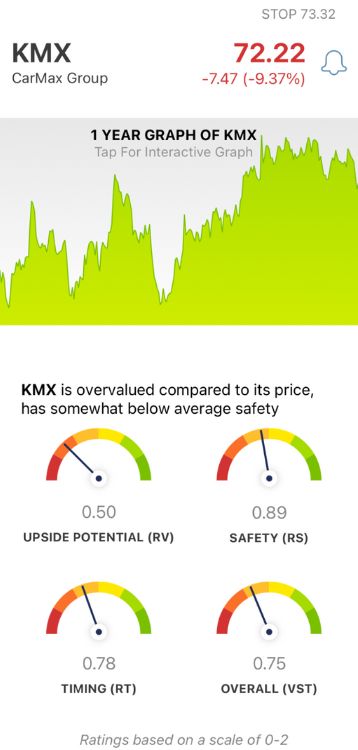
KMX Has Fair Safety, But Poor Upside Potential and Timing Holding it Back
The VectorVest system has outperformed the S&P 500 index by more than 10x over the past 20 years and counting. It’s all based on a proprietary stock rating system that gives you clear, actionable insights in 3 simple ratings: relative value (RV), relative safety (RS), and relative timing (RT).
Each rating sits on a scale of 0.00-2.00 with 1.00 being the average for quick and easy interpretation. And, better yet, you’re given a clear buy, sell, or hold recommendation based on the overall VST rating for any given stock at any given time. Here’s what we found for KMX:
- Poor Upside Potential: The RV rating looks at a stock’s long-term price appreciation potential (3 years out) compared to AAA corporate bond rates and risk. This is a far superior indicator than a simple comparison of price to value alone. And right now, KMX has a poor RV rating of 0.50.
- Fair Safety: The RS rating is an indicator of risk. It’s derived from an analysis of the company’s financial consistency & predictability, debt-to-equity ratio, and business longevity. KMX currently has a fair RS rating of 0.89, albeit a ways below the average.
- Poor Timing: As you can see based on the stock’s performance over the past few months, the timing is poor right now - and today’s news only strengthened that negative price trend. The RT rating of 0.78 is poor. It’s based on the direction, dynamics, and magnitude of the stock’s price movement day over day, week over week, quarter over quarter, and year over year.
The overall VST rating of 0.75 is poor for KMX - does that mean it’s time to cut losses, though, or is there still reason to believe that the company can get back to where it once was?
A clear buy, sell, or hold recommendation is just a click away through the VectorVest system. Make your next move with confidence by getting a free stock analysis today!


Want These Types of Insights at Your Fingertips so You Can Win More Trades?
Use VectorVest to analyze any stock free. VectorVest is the only stock analysis tool and portfolio management system that analyzes, ranks and graphs over 18,000 stocks each day for value, safety, and timing and gives a clear buy, sell or hold rating on every stock, every day.
VectorVest advocates buying safe, undervalued stocks, rising in price. KMX is down more than 9% after a disappointing earnings report that spoke to a larger concern with the used car market. And, the stock has poor upside potential and timing with below-average safety.
Before you invest, check VectorVest! Click here to ANALYZE ANY STOCK FREE and see our system in action!


Leave A Comment