BLUE-CHIP STOCK BARGAINS?
Written by: Robert and Russell Markham
It is often tempting to try to pick up a share that is heavily sold down, especially a stock paying a high dividend along with full franking credits! The general feeling for the adventurous investor is that you are picking up a bargain at never to be seen prices again. Hang on, are you sure you are picking up a bargain? What if the stock has further to fall? Those franking credits and dividends may be a small consolation considering the capital drawdown. Oh wait, you could just dollar cost average down because at some point the stock price comes back up…right?
You see where this is heading. Be wary of the above, chances are, you have thought along those lines at some point over the years. Maybe a few of you did take the plunge based on a gut feeling that the stock would come back and I am willing to bet that a lot of the times it did not work out too well.
What if we take a scientific approach where we only pick up blue-chip stocks that have been sold down heavily once the earnings start to rise again? That approach is going to serve you much better than guessing when a given stock will start rising again. We wait for the engine of future price appreciation potential (earnings) to start firing up again. Dollar cost averaging works on the proviso that a share price will come back up again at some point. There are plenty of cases in history where the share price never increased again. One powerful technique to confirm if a stock is likely to turn around is to check whether a given company is increasing its earnings, increasing its profit margin and moving up in price as confirmed by the technicals.
Let’s look at a recent well noted example in Australia: BHP
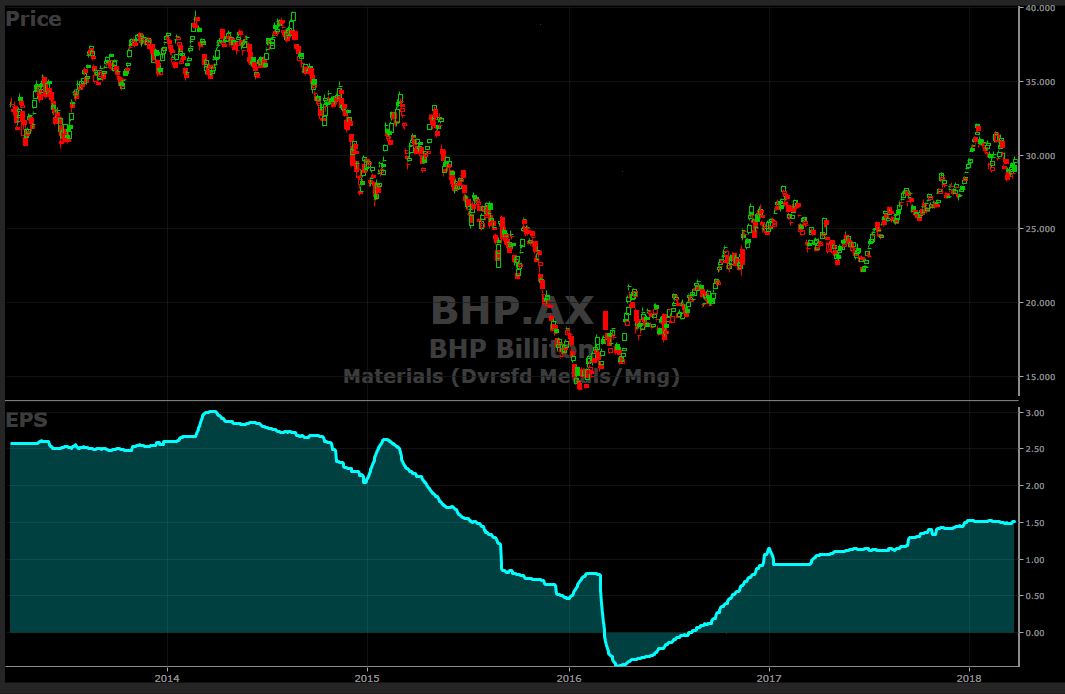
If you were looking to pick up a bargain in BHP.AX and if you were tempted to apply dollar cost averaging, you may have been tempted to buy in at around $30 dollars all the way down to $15. It would have been an unpleasant process buying into a stock that kept falling for over a year. Perhaps you would have sold out after continual price falls and got out altogether?
What if you had seen the turnaround with earnings rising again in December 2016? With rising earnings, you could have seen that the engine room of price appreciation potential was starting to fire up again when the share price was around the $25 mark. By March 2017, you would have seen the earnings pick up significantly. The earnings profile you see above is a proprietor 12 month leading forecast on earnings that VectorVest provides each day to our subscribers.
Which approach works for you? The hope of a stock coming back up in price as you apply dollar cost averaging on the way down or buying into a share where earnings are rising with a healthy earnings growth rate?
Now ask yourself this question, how does Telstra currently stack up in terms of the earnings profile? Are you going to dollar cost average in or are you going to wait for earnings to turn around?
CLICK HERE to take out a 30 Day Trial to VectorVest to check out Telstra’s Earnings profile
DISCLAIMER: PAST PERFORMANCE IS NOT INDICATIVE OF FUTURE RESULTS. YOU SHOULD CONSULT WITH YOUR LEGAL, TAX, FINANCIAL, AND OTHER ADVISERS PRIOR TO MAKING AN INVESTMENT WITH VECTORVEST


Leave A Comment