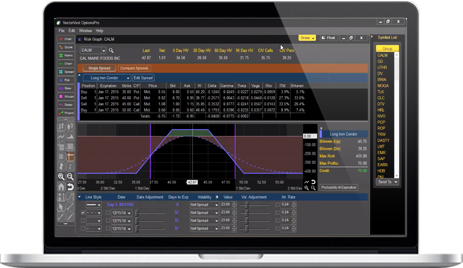
Accessible Options Trading
Snap up undervalued options. Sell overvalued options. Pinpoint the ideal window of time to sell, and collect far higher premiums. That’s OptionsPro: the ability to scan any list of stocks to spotlight the ones with the highest probability of delivering impressive profits, whether you’re more interested in buying or in selling options. If you really want to increase your probability of success in options trading, you’re going to love this tool.
OptionsPro’s Proprietary Tools will help you:
- Flag the right moment to sell any option with specialized theta decay charts
- Perfectly balance risk/reward for any spread trade
- Uncover undervalued options and steer clear of overvalued premiums
- Nail the highest probability trades with unique volatility studies
- Instantly identify which stocks could yield the juiciest option premiums using powerful scans
- Trade options like a pro, even if you aren’t
Successful options trading has never been easier. Try VectorVest OptionsPro now and make your next option trade extraordinary!
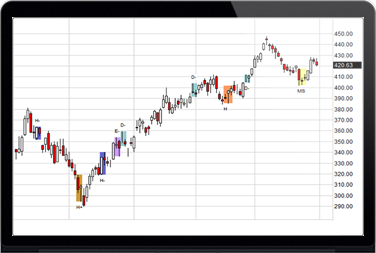
Candlestick Pattern Recognition and Scanning
Now you can easily spot reversal and continuation patterns. OptionsPro automatically scans, identifies and color-codes more than 10 high-probability candlestick patterns. You can choose from daily or weekly timeframes and bullish or bearish patterns (or both)!
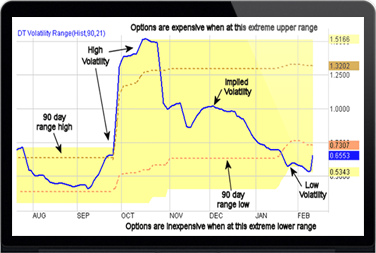
Volatility Range
Should you buy or should you sell? Options Pro’s proprietary Volatility Range Indicator will take the guesswork out of knowing when to buy or sell single-leg options or spreads. Using a unique study of implied volatility, it quickly identifies whether an option is overpriced or undervalued. If the indicator is high, odds are in the seller’s favor, if the indicator is low, odds favor the buyer. You can even scan for equities that are in the ideal position for your preferred strategy. Brilliant!
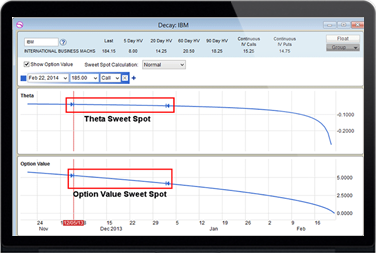
Sweet Spot Calculation
Hit the ‘sweet spot’ and accelerate your cash flow. Income traders will love the way OptionsPro’s Sweet Spot Calculation effortlessly reveals the ideal date range to sell any option. This calculation works in the background to identify the zone where you’ll receive the maximum time premium before time decay sets in at a rapid pace. The result? More winners, higher premiums and faster profits. Sweet!
Probability Envelopes
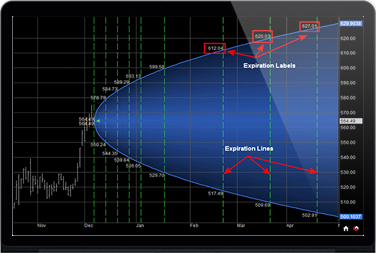
A picture’s worth a thousand words. Probability Envelopes enable you to see what your odds are, to make sure they’re stacked in your favor. Spread traders will find it invaluable in revealing which strike and expiration combos offer the highest probabilities of success.
Options Skew
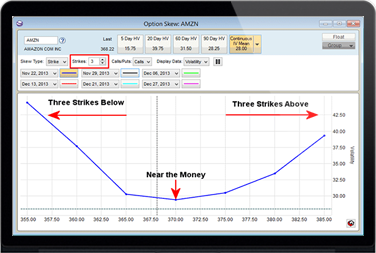
Simply a whole new way to look at options. The Options Skew graph brings the effects of implied volatility into focus, to show which strike prices offer the best values for buyers or the highest potential premiums for sellers. You can even compare multiple expiration dates on the same chart. Strike prices with higher volatility give sellers better opportunities for profits while strike prices in the lower volatility range are likely bargains for buyers.

