THE MARKET IS IN A CONFIRMED DOWN.
Written by: Russell Markham
The Australia Market went into a Confirmed Down (C/Dn) on the 29th of November. There should not be too many surprises here with plenty of warnings leading up to the C/Dn. That being, there were several red tiles popping up in the Color Guard (per the Home Page). A red tile in either the Price Column (which tracks the average price of all the stocks we track), the RT Column (Relative Timing of all the stocks we track) or the BSR (the Buy to Sell Ratio which is a ratio of our Buy rated shares versus our Sell rated shares) indicates that the given column has experienced a week-over-week drop in value as well as having dropped from the prior day.
 The VectorVest Color Guard as found on the VectorVest homepage.
The Color Guard is such a powerful visual representation of the market. All you need to do is simply look at the colours in the Color Guard. A whole lot of red indicates the market is heading down, a whole lot of green indicates the market is heading up and a whole lot of yellow tiles indicates transition (either to the upside or downside).
As you have access to the US, Canada, Europe and UK markets – if you had been logging into any of these countries in addition to Australia, the same narrative was playing out. No doubt, for those of you who invest in the US market as well at the Australia market, Australia follows what takes place in the US market very closely. The red tiles in the Color Guard for the US market started to flash up on the 16th of November with the C/Dn for the US market taking place on 22nd of November. The US provided the early signal several days before Australia got its C/Dn. Pay attention to the US market, the US can provide you with an early indication of where the Australia market may be headed. However, do not lose sight of what is taking place in Australia. Let VectorVest guide you.
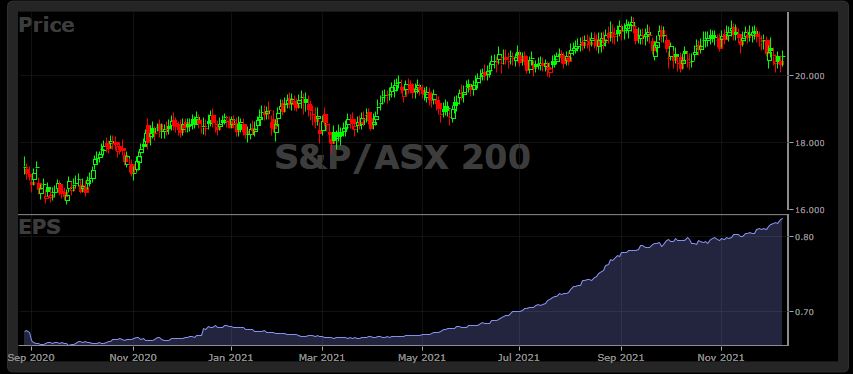
Will this C/Dn be long? Nobody can predict. However, let’s look at the fundamentals in play here. On the Market Climate Graph, we have a great indicator called the ETI (Earnings Trend Indicator). The ETI is heading up. This tells us that the outlook for corporate earnings remains robust. In fact, if you load up the ASX 200 WatchList, you will see that the Earnings Per Share (EPS) along with Earnings Growth Rate (GRT) are holding steady. Confused by this? You need not be. A market may very well hold strong fundamentals, but it does not necessarily mean it will rally all the time. The rally in recent months on the ASX has been nothing short of spectacular.
 VectorVest ASX200 Watchlist with EPS per the blue area graph (VectorVest’s EPS is a 12 month leading forecast on earnings)
It could very well mean that this is nothing more than a well-earned rest before the next journey up. While nobody can tell you what will happen next, what you can do each day at VectorVest is study the market and follow the trend. Right now, that trend is down. The ingredients are in play for another leg up…we will wait patiently until the green lights in the Color Guard start to flash up again before considering going back into the market.
If you have your trading plan all setup already (via BackTester and Portfolio Manager) and you are happy with your trading plan, then you are all set. Please click here to see a short video with VectorVest in action, going over Market Timing.
VectorVest Inc (ARBN 654 498 218) is an Authorised Representative (No. 1294036) of Centra Wealth Pty Ltd (ABN 39 158 802 450) which holds an Australian Financial Services License (AFSL No. 422704). Please refer to our Financial Services Guide which provides you with information about us and services we can provide. Any advice is general in nature and has not considered your personal objectives, financial situations or needs. You should consider whether the advice is suitable for you and your personal circumstances. BackTest results and Model Portfolio performance and profit calculations are theoretical and calculated by VectorVest Inc and do not reflect actual investments in the companies mentioned. No representation is being made that any account will or is likely to achieve profits or losses similar to those shown. Actual results may be affected by known or unknown risks and uncertainties that cannot be reasonably included in a BackTest, and therefore these outcomes can differ materially from BackTested expectations. As a result, past performance should not be relied on as a guarantee for future results. The value of any investment and income derived from it can go up and down. It is important to remember that when investing in equities and derivatives it is possible to lose some or all of your investment.


Leave A Comment