Hello everyone,
I am pleased to announce 6 new portfolios.
Please note that these portfolios are for education purposes only through the use of the VectorVest 7 Australia. You should seek financial advice in regards to your investments.
The 6 new portfolios can be found as follows:
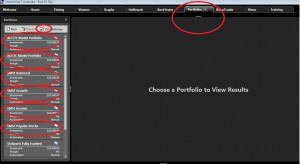
- Click on Portfolios (per the top Tab in the VectorVest 7 Australia)
- Ensure you have ticked “VV portfolios”
Please see screen shot per below:
Click image to make larger
The new portfolios are as follows:
- AU ETF Portfolio
- AU LIC Model Portfolio
- SMSF Balanced Portfolio
- SMSF Growth
- SMSF Income
- SMSF Popular stocks
We will track these 6 new portfolios going forward. There is a good mix of portfolios in the above list – to provide you with an idea of the types of stocks applied in given portfolios.
Please note: These portfolios do not include the dividend returns or any franking credits.
Per below is a brief overview of each portfolio:
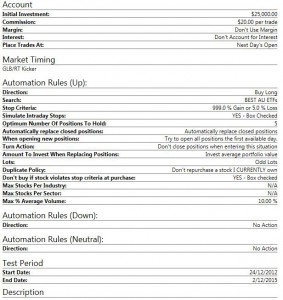
The ETF Portfolio is searching for Australian ETFs and exclude any Contra-ETFs (ETFs that are effectively shorting ETFs). It is looking for the price of the ETF to be above $30 AUD and ensuring that the stocks are not a sell rated with a good short term price momentum (RT) and persistent price performance (CI). To find out more on this given search that his portfolio makes use of – please check out UniSearch Folder: ETFs – and within that folder the search is: Best AU ETFs. For a full technical brief on how this portfolio was built – please refer to the attachment below.
Click image to make larger
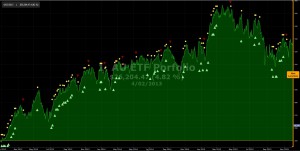
The AU ETF portfolio has annualised over 10% returns since January 2013. There was a pull back in July 2015 but the portfolio is has started to resume its upward momentum. Returns to date have been over 10% annualised. This portfolio has only made 5 trades since inception. Check out the portfolio in VectorVest 7 Australia for further details.
Click image to make larger
2. AU LIC Model Portfolio
The AU LIC Model Portfolio is looking for Australian listed investment companies. The portfolio makes use of the search SMSF LICs (under Searches- SMSF in UniSearch). The portfolio finds listed investment companies that are safe (RS above 1) that have good dividend yield (DY greater than or equal to 2%). The find is sorted by the fasted moving stocks (RT) that are the most persistent (CI). Please refer to the attachment below for further details.
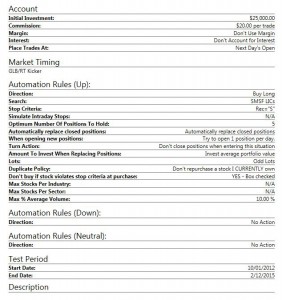
Click image to make larger
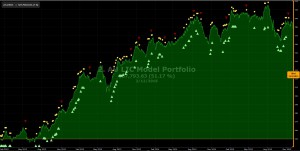
The AU LIC portfolio has averaged over 13% annualised returns since January 2012 (as of December 2015). Despite the market volatility in 2015 – the portfolio continues to hold up well. The LIC Model Portfolio has the lowest volatility of the 6 portfolios. The maximum drawdown* is 10.29% as of 2 December (since January 2012 to 2 December). This is impressive considering market conditions since 2012.
Click image to make larger
3. SMSF Balanced
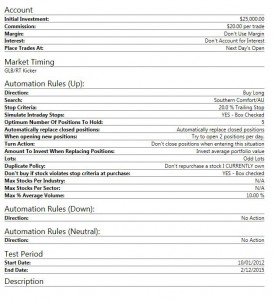
The SMSF Balanced portfolio applies the Southern Comfort SC Div search per the Searches – Precision Trading folder in UniSearch. The stocks being found for this portfolio are stocks over $1 but less than $5, along with at least 50,000 trades a day on average over the last 50 days to ensure liquidity. These stocks are also in the top 50 RT ranked stocks (stocks moving up the quickets). This search also ensures a good dividend yield is greater than 2%. The stocks are then sorted to ensure the best combination of short term price movement (RT), Fundamental and technical (VST) and price persistence (CI) on a dollar by dollar basis. The portfolio settings are listed below:
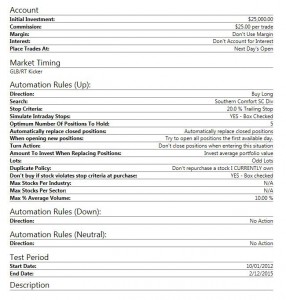
Click image to make larger
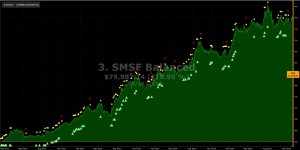
The SMSF Balanced portfolio has continued to run from strength to strength – with continue growth of over 20% in 2015. Overall volatility of this portfolio has been low – with an average of 8 trades a year.
Click image to make larger
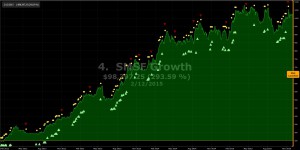
4. SMSF Growth
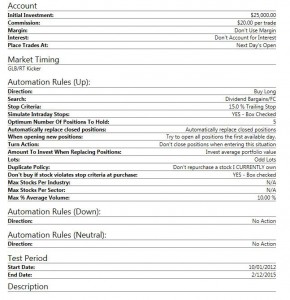
This portfolio applies the Southern Comfort/AU search per UniSearch (under Searches – Precision Trading folder). This portfolio is identifying stocks that are between $1 and $5 that are found in the top 50 VST stocks. The stocks are sorted such that stocks with the best price downturn resistance are found by sorting them by CI (Comfort Index) in descending order.
The portfolio applies a 20% trailing stop loss to ensure minimal trading – with a maximum of 2 stocks bought per day until a 5 share portfolio is achieved. The timing system applied is the GLB/RT Kicker timing signal. The settings for the portfolio are as follows:
Click image to make larger
The SMSF Growth portfolio has had significant growth since 2012 – annualising over 70% returns (as of December 2015). The portfolio as seen strong upward momentum resume from September 2015. This portfolio averages less than 10 trades a year.
Click image to make larger
5. SMSF Income
The portfolio applies Dividend Bargains/FC per the Franking Credits Folder in Unisearch. The portfolio ensure that only fully franked dividend stocks are selected – of at least 2% or better Dividend Yield. The portfolio places more emphasis on stocks that are undervalued – by applying the sort: Value/Price.
Click image to make larger
The SMSF Income Portfolio returns are exclusive of dividends and franking credits and therefore the graphic per below understates the returns. Once can comfortably add a further 2-4% on the annualised returns below to reflect the dividends and franking credits. Despite the recent drawdown in the prevailing 2015 market conditions, the portfolio continues to annualise over 15% (as of December 2015).
Click image to make larger
6. SMSF Popular stocks
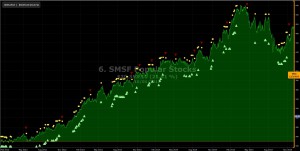
This portfolio will only select some of the most widely known and held stocks held in Super Funds in Australia. To see a full list of these stocks – refer to Special Watchlists (per viewrs tab). Within the Special Watchlists folder – you will see the watchlists entitled Popular SMSF Shares. This portfolio finds stocks with the best combination of short term price momentum (RT) and Price persistence (CI).
This portfolio applies a stop lost of: VST<1 – to ensure stocks that have a deteriorating fundamentals and or technical are replaced. Overall, this portfolio has maintained a very low amount of trades per year – with 7 trades since January 2012 until December 2015 – while averaging over 20% annualised returns a year on average.
Click image to make larger
The SMSF Popular stocks portfolio has resumed its upward momentum in October 2015 – annualising over 20% a year since January 2012 to December 2015. This portfolio has averaged less than 2 trades a year since January 2012 to December 2015.
Click image to make larger
PAST PERFORMANCE IS NOT INDICATIVE OF FUTURE RESULTS. YOU SHOULD CONSULT WITH YOUR LEGAL, TAX, FINANCIAL, AND OTHER ADVISORS PRIOR TO MAKING AN INVESTMENT WITH VECTORVEST
*’Maximum Drawdown
“The maximum loss from a peak to a trough of a portfolio, before a new peak is attained. Maximum Drawdown (MDD) is an indicator of downside risk over a specified time period. It can be used both as a stand-alone measure or as an input into other metrics such as “Return over Maximum Drawdown” and Calmar Ratio. Maximum Drawdown is expressed in percentage terms and computed as:
(Trough Value – Peak Value) ÷ Peak Value”
Source: http://www.investopedia.com/terms/m/maximum-drawdown-mdd.asp






With the SMSF Growth and SMSF Balanced portfolios is there any reason stocks were restricted to below $5? Will be watching these portfolios closely once the market turns.