by Leslie N. Masonson, MBA
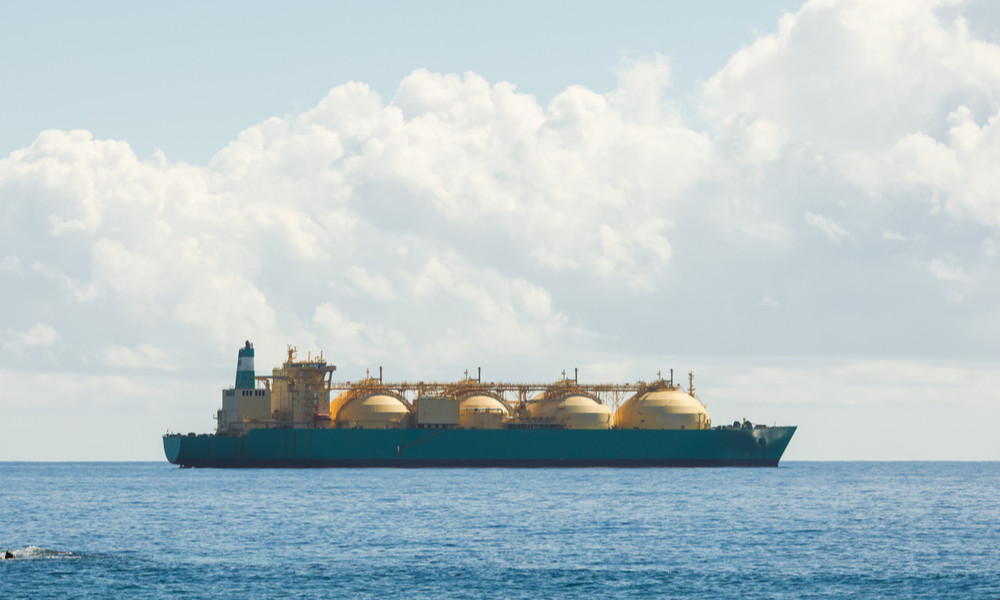
Stealthgas Inc. (GASS), is a Nasdaq-listed firm incorporated in 2004 with headquarters in Athens, Greece. The company provides global seaborne transportation services to LPG producers and users, as well as ships natural gas and crude oil. The company maintains a fleet of 36 LPG ships with a capacity of nearly 300,000 cubic meters. Revenues totaled $155 million, and GASS’s market cap is $215 million.
The stock has a minimal Wall Street following of only 30 institutions, mostly hedge funds, owning 46% of the outstanding shares, while insiders own 23%; however only four mutual funds hold less than 0.70 % of the shares in total. This lack of interest is not a plus for the company as institutions and mutual funds typically are the driving force in pushing stock prices higher when they get onboard. This is certainly not the case so far.
GASS resides in VectorVest’s Shipping Transportation grouping and is rated #2 out of 51 companies. Moreover, it is ranked #4 in the broader Transportation sector out of 156 stocks. Note that the group itself is ranked 28th in Relative Timing (RT) out of 222 tracked industries.
The stock has shown itself to be a leader and its VST of 1.43 places it 19th out of 9,136 stocks in the VectorVest universe, certainly an excellent performer overall and one that should be placed on investor watchlists. The average daily trading volume of 355,000 is sufficient for traders and investors looking for a tight bid-to-ask spread. Moreover, the stock’s Beta of 0.99 is in line with the S&P 500 Index.
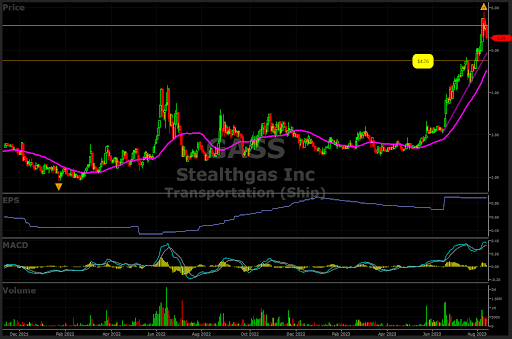
The stock price cratered from a high of $13 on November 18, 2013, to a low of $1.51 on March 18, 2020. Then it stalled in a trading range of $2.00 to $3.10 for two years before drifting lower to $1.91 on January 24, 2022. As you can see in a more recent chart, GASS started to accelerate to the upside on June 20, 2023. It took off from about $3.50 to its recent high of $5.90 on August 9, its highest level since 2015. Note that since June, the trading volume has been well above average and that has been the case also since December 2022. The stock price hit a quadruple resistance level of $4.76 in 2016, 2017, 2018, and July 2023, but has finally broken through after seven years. This is a very positive development.
Moreover, the stock price has advanced 89% over three years beating the 34% return of the S&P 500. This was due to earnings improvement. Over the past year, it is up 70%. These are all positive characteristics of a momentum stock.
The earnings trend reversed upward in June 2022 and is at its highest reading in years. The next earnings report is due between August 22 to 28, and investors possibly interested in a purchase should wait for the results before jumping aboard. Trying to front-run and buy before an earnings release is playing with fire, and should always be avoided.
Stealthgas Sports High VectorVest Scores, Is Undervalued and Has Been a Top Market Performer in Past Year
The VectorVest system issues a clear buy, sell, or hold recommendation for any given stock, at any given time. This is all possible through a proprietary stock rating system that boils down everything you need to know into 3 simple ratings.
These are relative value (RV), relative safety (RS), and relative timing (RT). Each sits on its own scale of 0.00-2.00, with 1.00 being the average for quick and easy interpretation. As for X, here’s what we found:
- Excellent Upside Potential: The Relative Value (RV) rating focuses on a stock’s long-term, three-year price appreciation potential. The current RV rating for GASS is 1.45 which is significantly above average on a scale of 0.00-2.00. The current stock price is $5.29, while VectorVest places its value at $6.83, indicating a potential 29% upside if it attains that value.
- Fair Safety: The Relative Safety (RS) rating is based on the company’s business longevity, financial predictability/consistency, debt-to-equity ratio, and additional risk parameters, including price volatility. Its RS rating of 0.88 is below average, indicating above-average risk. So, this stock is not well-suited for conservative investors.
- Excellent Timing: The Relative Timing (RT) rating focuses on the price trend over the short, medium, and long term. The components include price direction, dynamics, and price magnitude of price changes over daily, weekly, quarterly, and yearly comparisons. GASS has a very high RT rating of 1.60 compared to the average of 0.94 for all the stocks in the database which means that the stock has been an above-average superior performer over multiple timeframes.
- Very Good Comfort Index: This index measures the consistency of a stock’s long-term resistance to severe and lengthy corrections. This index compares the individual stock to the fluctuation of the VectorVest Composite price measured on a scale of 0 to 2.00 at a level of 1.29, GASS’s rating is well above average.
- Excellent Earnings Growth Rate (GRT): DAL’s current sales growth over the last 12 months is 6%, with an accompanying 29% strong forward-looking growth rate. The latter is measured over a forecasted three-year period. As these important fundamental factors are captured in the VectorVest software, you can quickly get a picture of the company’s fundamental measurements with a few mouse clicks.
- Excellent VST Score: The VST Master Indicator ranks 9,136 stocks from high to low and brings stocks with the highest VST scores to the top of the list. DAL’s VST is 1.36, which is well above average. Using VST enables subscribers to identify stocks that are performing much better or worse than average, and GASS is clearly in the former category.
To sum up, the majority of metrics reviewed indicate a positive backdrop for GASS going higher, and both conservative and aggressive investors may find that this stock should be in their respective portfolios. If you are considering GASS for a purchase, be aware of the big price run-up since early June. A retracement to the $4.76 resistance point is certainly possible. And that resistance test needs to hold or the price could retrace all the way to $3.23.
Currently, the stock is nicely positioned above its 40-dma and MACD, as well as above the purple trendline, and the volume has been increasing since June. Make sure to wait for its upcoming earnings release the last week in August before making any decisions. Now is a good time to take a 30-day trial to VectorVest, if you don’t currently subscribe, as August and September are historically the two worst-performing months of the year, and you don’t want to be going long if the market is tanking.


Want These Types of Insights at Your Fingertips so You Can Win More Trades?
Use VectorVest to analyze any stock free. VectorVest is the only stock analysis tool and portfolio management system that analyzes, ranks and graphs over 18,000 stocks each day for value, safety, and timing and gives a clear buy, sell or hold rating on every stock, every day.
Before you invest, check VectorVest! Click here to ANALYZE ANY STOCK FREE and see our system in action!


Leave A Comment