
By Leslie N. Masonson, MBA
Arch Capital Group Ltd. (ACGL) is a Nasdaq-listed firm that was incorporated in Delaware in 1995 but is headquartered in Pembroke, Bermuda, with 5,800 employees. There are 373 million shares outstanding. Revenues totaled $1.8 billion, and ACGL’s market cap is $29.04 billion.
The company and its multiple subsidiaries offer general insurance, reinsurance, accident, disability, travel, as well as mortgage insurance and reinsurance on a global basis, including the U.S., Canada, Europe, Australia, and Hong Kong. Also, they offer excess casualty and primary insurance. Their products are marketed via independent and wholesale brokers.
Although most investors are not familiar with the company, it has not escaped the attention of institutional investors. The stock has a wide following, with 947 institutions owning a whopping 91.4% of the outstanding shares, while insiders own a meager 3.2%. Vanguard Group and its various mutual funds and ETFs own 18.6% of the shares, followed by Blackrock Inc., which owns 7.1%, and Artisan Partners Limited Partnership and its International Value Funds, which own 10%. Lastly, State Street owns 4.1%. Having these heavyweight institutions owning the shares shows their commitment to this firm’s favorable future prospects.
Baron Funds, run by Wall Street legend Ron Baron, who is an astute stock picker, also owns 7.1% of the ACGL shares, quite a substantial stake. They highlighted ACGL in their Second Quarter 2023 investor letter, saying, “…Pricing trends in the property and casualty insurance market remain favorable, and higher interest rates are driving higher investment yields. We continue to regard Arch’s management team as exceptional and expect Arch to continue to achieve strong growth in earnings and book value.”
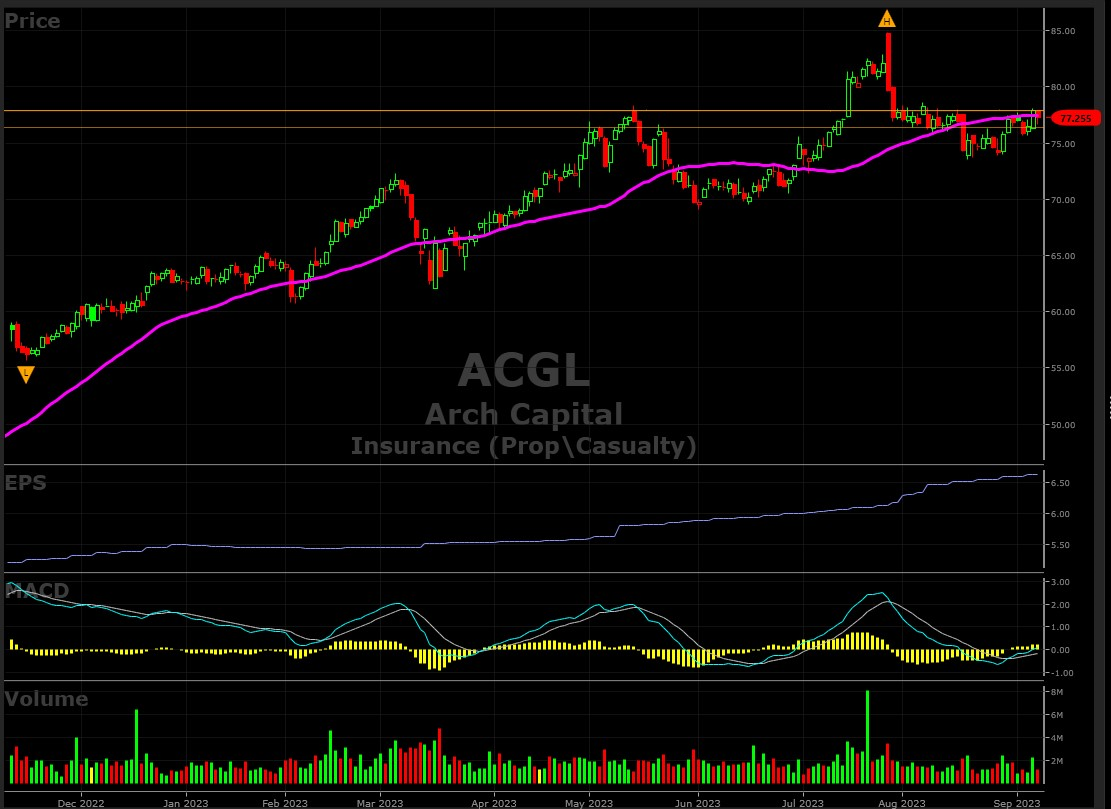
Since its low of $41.03 on September 26, 2022, the stock has more than doubled to an all-time high of $84.83 on July 27, the day of its earnings release. During the day, the price had a wide $6 spread from high to low, with a huge bearish engulfing candle resulting in a continued slide down the next 40 days. However, the price has stabilized around $78 last week. A breakout above the nearby resistance level of $78.67 could provide the impetus required to reach the high ground at $85. Its Beta of 0.72 means that the stock price is 28% less volatile than the market, which is a positive metric.
ACGL resides in VectorVest’s Insurance (Prop/Casualty) grouping and is rated #1 out of 64 companies. Moreover, it is also ranked #1 in the broader Insurance sector out of 130 stocks, which is even more impressive. Note that the Group itself is ranked #35 in Relative Timing (RT) out of 222 tracked industries, a favorable showing. When a stock is also in a highly ranked group, that is a big plus, as similar stocks move together as a herd.
ACGL Displays Four “Excellent” Metrics, Is Way Undervalued and Has Been a Top Market Performer
The VectorVest software issues buy, sell, or hold recommendation on all the 9,142 stocks and ETFs tracked. This proprietary stock rating system breaks down the data into three simple ratings: relative value (RV), relative safety (RS), and relative timing (RT). Each is measured on its own scale of 0.00-2.00, with 1.00 being the average for quick and easy interpretation, and 2.0 being the best.
As for ACGL, its current metrics are as follows:
- Excellent Upside Potential: The Relative Value (RV) rating focuses on the stock’s long-term, three-year price appreciation potential. The current RV rating for ACGL is 1.61, which is exceptional. The current stock price is $77.26, but VectorVest places its value at $116.34, indicating a significant 51% potential upside that offers substantial gains.
- Excellent Safety: The Relative Safety (RS) rating is based on the company’s business longevity, financial predictability/consistency, debt-to-equity ratio, and additional risk parameters, including price volatility. Its RS rating of 1.44 is well above average, indicating below average risk which makes it a great candidate for conservative investors.
- Good Timing: The Relative Timing (RT) rating focuses on the price trend over the short, medium, and long term. The components include price direction, dynamics, and price magnitude of price changes over daily, weekly, quarterly, and yearly comparisons. ACGL has an above average RT rating of 1.14 compared to the average of 0.86 for all the stocks in the database which means that the stock has been a better performer over multiple timeframes.
- Excellent Comfort Index: This index measures the consistency of a stock’s long-term resistance to severe and lengthy corrections. This index compares the individual stock to the fluctuation of the VectorVest Composite price. ACGL’s rating of 1.59 is exceptionally high and is also in the top 1% of the universe. It is rare for the Comfort Index to be so high with a stock that has other excellent ratings, so that is another huge positive.
- Excellent Growth Rate (GRT): ACGL’s current sales growth rate over the past 12 months has been 43%, and its forward-looking earnings growth rate is 27% (measured over a forecasted three-year period), both indicative of very solid fundamentals. These two factors, among many others, are captured by the VectorVest software. Therefore, you can quickly get a picture of the company’s fundamental measurements with a few mouse clicks.
- Very Good VST Score: The VST Master Indicator ranks all stocks from high to low with those stocks with the highest VST scores at the top of the list. ACGL’s VST is 1.39, which is well above average. Moreover, this stock is ranked #31 in VST out of 9,142 in the VectorVest database which means it is in the top 4/10th of 1% of all stocks, quite an achievement. Using VST enables subscribers to identify stocks that are performing much better or worse than the average, and ACGL is clearly in the former category.
In conclusion, ACGL’s outstanding metrics should propel the stock price much higher. Moreover, as the chart below shows, the stock really took a sharp dive after the earnings release but has been consolidating for the past month. Volume is increasing on up days and shrinking on down days, indicating accumulation. Also, the average daily volume of 1.9 million shares provides buyers with tight bid-to-ask spreads.
If you're considering adding ACGL stock to your portfolio, realize that the current market is in a “Confirmed” downtrend where VectorVest recommends no new purchases at this time. Moreover, the VectorVest Composite candlestick chart of all the stocks tracked has formed a bearish head-and-shoulders pattern, which could mean a further decline from here.
If you purchase the stock, be sure to place a stop-loss order just below the recent $76.30 support level. Currently, the stock price sits slightly below its 40-DMA, which needs to be taken out by a positive crossover. Also, check ACGL's MACD, which is currently positively sloped, but wait for the price to break above $79. Now is a great time to take advantage of a 30-day trial to VectorVest, to make sure the VectorVest Daily Color Guard and ACGL stock are both on 'BUY' signals before taking any action.


Want These Types of Insights at Your Fingertips so You Can Win More Trades?
Use VectorVest to Analyze any stock free. VectorVest is the only stock analysis tool and portfolio management system that analyzes, ranks and graphs over 18,000 stocks each day for value, safety, and timing and gives a clear buy, sell or hold rating on every stock, every day.
Before you invest, check VectorVest! Click here to ANALYZE ANY STOCK FREE and see our system in action!


Leave A Comment