HAS A2 MILK TURNED THE CORNER?
A2 Milk (A2M.AX) had a stellar run from 2015 through to 2020 with its price going from around $0.50 to $19.83 on 29 June 2020. The price then started falling rapidly and towards the end of 2023, the price was below $5. What happened?
A2M.AX’s business was adversely impacted by a Covid related decline in sales from “daigou buyers.” A “daigou buyer” is someone local who buys for someone else living in China. Furthermore, China’s demand for milk powder has been further impacted by the decline in China’s birth rate.
This led to disappointing results for A2M.AX with inventory write-downs and falling sales driving earnings down.
However, things are starting to turn around:
The 2024 Interim Results report disclosed some impressive figures including:
- 3.7% revenue growth.
- In top 5 China Infant Milk Formula (IMF) sales/market share due to extensive marketing.
- Cash on hand increased by USD 34.9 million to USD 792.1 million.
- Revenue grew by 8.6% in the US Market.
A2M.AX is at a 10-month high with the share price closing at $5.61 on 20 February 2024 – up over 30% for the year so far.
Let’s use our VectorVest tools to do further analysis of A2M.AX. Go to the Graphs tab on the main toolbar and then type in A2M.AX in the search box to bring up the A2M.AX graph. Ensure you have selected Earnings Per Share (EPS), Sales, and Net Profit Margin (NPM) in your graph layout. If you do not have these parameters displaying, click on Add Parameter and add them to your graph layout. (EPS will be found under Capital Appreciation; Sales under Sales/Market Capital and NPM under VectorVest Fields.)
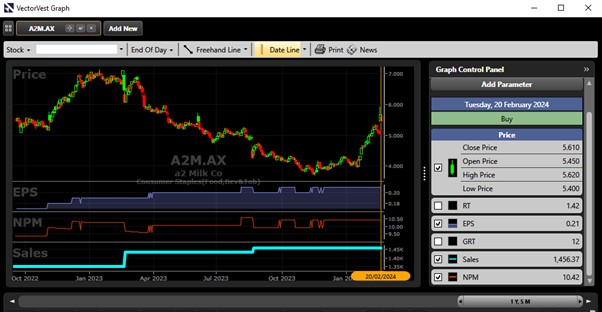
Notice how EPS has been steadily rising over the last year—earnings are the engine of share price growth! Notice too how sales have been steadily moving up. How much money you make on each sale is represented by NPM. You can see how NPM has been holding steady and increasing slightly and, when combined with rising sales, this bodes well for future earnings.
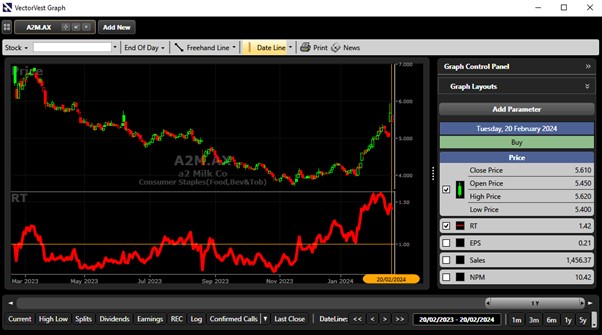
Has A2M.AX turned the corner? It may be too early to make that call, but right now, the fundamentals (Relative Value, RV and Relative Safety, RS) are positive and above 1.00. Short-term price momentum (RT) is strong and rising at 1.42. You can add this to your graph per below:
If you wish to keep an eye on A2M.AX, use your VectorVest tools and don’t forget to stay on the right side of the market using VectorVest’s Market Timing Systems.
Residents of Australia:
VectorVest Inc (ARBN 654 498 218) and Russell Markham are Authorised Representatives (No. 1294036 and No 1294037) of Centra Wealth Pty Ltd (ABN 39 158 802 450) which holds an Australian Financial Services License (AFSL No. 422704). Please refer to our Financial Services Guide which provides you with information about us and services we can provide. Any advice is general in nature and has not considered your personal objectives, financial situations or needs. You should consider whether the advice is suitable for you and your personal circumstances. Backtest results and Model Portfolio performance and profit calculations are theoretical and calculated by VectorVest Inc and do not reflect actual investments in the companies mentioned. No representation is being made that any account will or is likely to achieve profits or losses similar to those shown. Actual results may be affected by known or unknown risks and uncertainties that cannot be reasonably included in a backtest, and therefore these outcomes can differ materially from backtested expectations. As a result, past performance should not be relied on as a guarantee for future results.
TERMS AND CONDITIONS: https://vectorvestau.wpengine.com/terms-and-conditions/
PRIVACY POLICY: https://vectorvestau.wpengine.com/privacy-policy/


Leave A Comment