WESTPAC BANK RESULTS SURPRISE TO THE UPSIDE.
Written by: Robert and Russell Markham
Westpac Bank (WBC.AX) came out with their 2020 interim results on 4th May (as alerted to last week). As you can reasonably guess, the results were not too flash (once again, those of you who have been following VectorVest will have been watching the anemic EPS scores for many a month now). Ironically, on the 4th of May after the announcement, the price shot up 2.8% followed by a further 2.7% the day after. Why did the price rise? The fall in profits were not as much as expected. Recall the Essay written back on the 23rd of August 2019 (Earnings Reports, Analysts Expectations and Share Prices).
Back to the results for WBC.AX. Some of the key highlights for WBC.AX’s release on 4th May include:
* Net profit down 62%
* Cash earnings down 70%
* Interim dividends deferred for now until June at the earliest
* A $1.6 billion AUD provision for loan losses
Bad debts chewed through $2.2 billion in profits and AUSTRAC (Australia’s enforcement agency that investigates money laundering and other such financial crimes) entailed a $1 billion AUD cost. AUSTRAC was avoidable! Shareholders rightfully will be unforgiving over AUSTRAC (with the CEO at the time resigning over this), but more sympathetic towards bad debts considering what is taking place currently. With the news not as bad as expected, WBC.AX has seen a little bit of a run, but that niggling decline in the EPS is still there and, until EPS starts to move back up, I believe there is more downside yet.
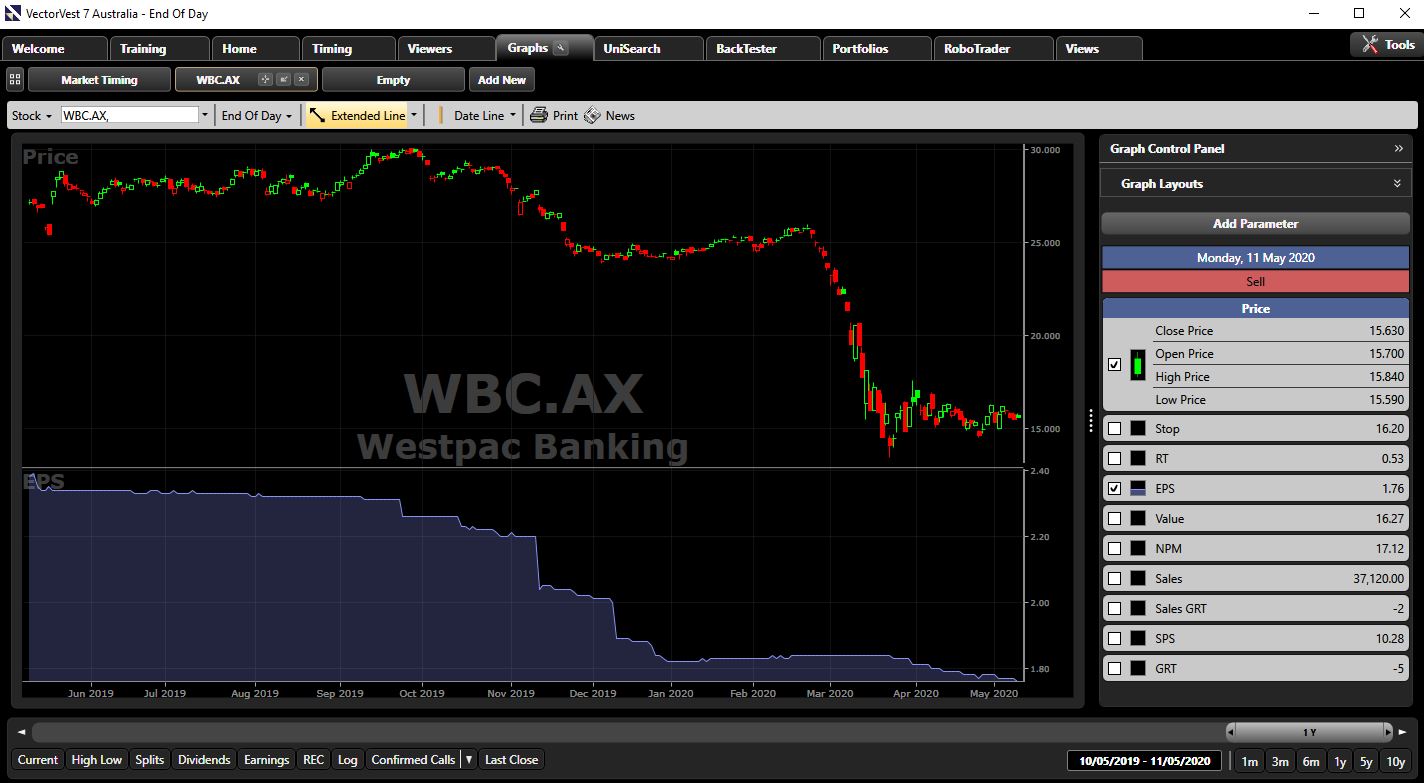
Let’s take a look at WBC.AX’s EPS in recent years. To view the EPS for Wesptac Bank, click on the Graph tab per the top of your screen. Per the top left part of your screen, just to the right of Stocks enter in WBC.AX in the blank box and press enter. This will load up the WBC.AX graph. Per the right of your graph, per the Graph Control Panel, click on the dropdown arrow (next to Graph Layouts) and select the layout: VectorVest Simple. Turn off Relative Timing (RT) by unselecting this on your graph and the Stop line. Set the graph back 10 years by clicking on the 10y button per the bottom right of your graph. Notice the decline which started in 2016 and sped up significantly in 2019. The rate of decline in the last few months has been very steep indeed. Since the start of 2020, WBC.AX’s Price is down over 34%.
Per your Graph Layouts and the Graph Control Panel, you will see Value (near the bottom of your parameters you can add to your graph). Click on the square to the left of Value to add this to your graph. Notice how Price has come down to meet Value. Price typically goes to meet Value when EPS is trending lower and not the other way round. With falling earnings in a falling market, it is a quick way to ensure any premium willing to be paid is stamped out. VectorVest is, as of 5th May, noting the valuation of WBC.AX at $16.27 per share. If the EPS keeps falling, Value will come under pressure and fall too. It is fair to say that any premiums (extra cost being paid for a share above the valuation) willing to be paid have come to an end for now. And with dividends deferred, there is even less reason to be willing to pay a premium for WBC.AX. Check out the other big 3 banks and notice how the valuations are not on par with the price currently being paid either.
On a final note, a lot of articles out there are talking about when it is the right time to start picking up banking stocks again. Is it bargain time to buy WBC.AX? As we have seen over the years, with rising EPS scores and rising share prices. I am going to wait for the share price to start going up and wait for EPS to start rising and most importantly check to ensure the market is rising! At VectorVest we note: Buy Rising Shares in Rising Markets with Rising Earnings. I will not be tempted to purchase WBC.AX until I see otherwise. Do not fool yourself and buy into shares with falling earnings in a falling market.
Again, on a final note, do not miss the VectorVest Financial Freedom Summit. The Summit is all about empowering you, giving you the knowledge and tools to make money in the market. It is being held over the 18th to the 20th of May. Please click here to register for the event at NO cost to you. Per registration link, you will also see the agenda over the 3 days.
Please note, the times are given in US Eastern Time equivalent.
The 3 Australian talks are:
Tuesday, 19 May at 9:00am: High Net Profit Margin
Tuesday, 19 May at 9:45am: Asset Allocation & VectorVest: The Secret to Managing Investment Risk Better than a Professional (Zac Zacharia, Director of Investments at Centra Wealth Management)
Tuesday, 19 May at 10:15am: Gold Stocks – The Australian Experience Over the Last 12 Years
Have a look at some of the other talks from around the world; what an action-packed Summit it will be! I cannot wait to listen to these great talks!
Here is a handy link to covert the talks times from Eastern Time (US) to Australian time equivalent across our major regions: CLICK HERE


Leave A Comment