Written by: Robert and Russell Markham
I have written extensively on the need to identify rising earnings in recent months. Today, I wanted to show you a very interesting way to look at the impact of rising earnings and how it relates to a rising share price and dividends paid.
To demonstrate this, I want to do a quick exercise. Let’s concentrate on 2 stocks. The first stock is Rea Group Ltd (REA.AX) for Australia. The second stock is Ross Stores (ROST) in the US. Most of you have access to the US market as your second country. Do make use of your second country! You have the tools to find great stocks outside of Australia. You just apply the same techniques you apply for Australia; it is as simple as that!
In VectorVest Australia, click on the Graphs tab. Then type in the ticker code REA.AX to the right of the word Stock and hit enter. Change the graph layout to be VectorVest Simple (to the right under the Graph Control Panel, click on Graph Layouts and select VectorVest Simple. Remove Relative Timing (RT) and remove the Stop line (by unselecting these per the Graph Control Panel on the right). Now click on Add Parameter, hover your mouse over Dividend Analysis and then select DIV – (Dividend Paid). Ensure that DIV is selected such that you have this on your graph. You should now be seeing the Price, EPS and DIV.
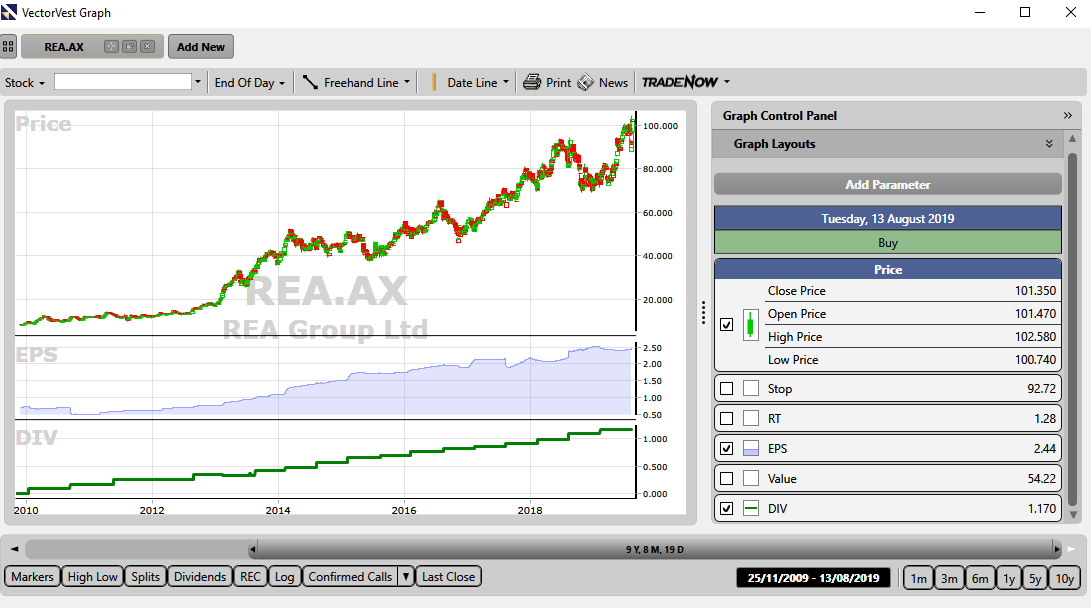
Set the time frame of the graph to be from 2 January 2007 to 17 July 2019. Per the date window at the bottom right of the Graph, click on the date box and change the start date to 2 January 2007 and the end date to 17 July 2019. Have a look at the graph, interesting! Rising earnings, rising Dividends Paid (DIV) and rising share price! If you think about companies with growing earnings, are these companies more or less likely to pay dividends? Likely to pay more dividends of course as they are making more money!
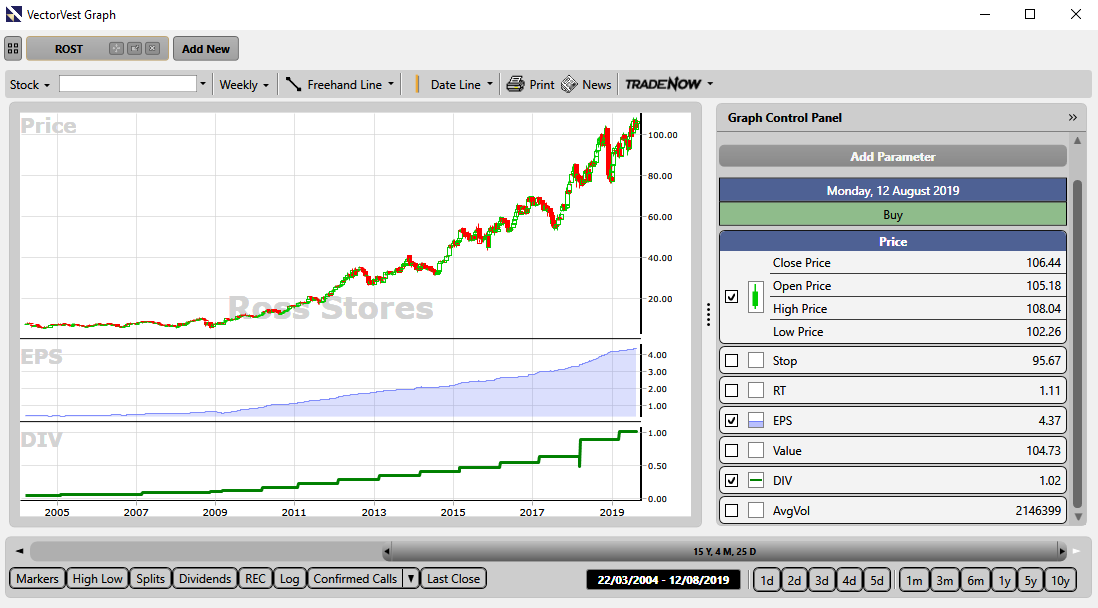
Now log into VectorVest US (if you have access to the US Market, if not, not to worry, at the end of the essay I will put a link where I will demonstrate this in a short video). Just like you did for Australia, click on Graphs, and then add in the ticker code ROST. Set your Graph up in the same way as described above, but set the start date to 13 May 1996 and select the same end date. See the same patterns? Notice how EPS rises, so too does DIV along with the share price!
How do your Price, EPS and Dividend graphs stack up? Find top EPS stocks to improve your capital returns and dividends!
To see the short video on this – refer to this link:
https://www.dropbox.com/s/wojepeboxi31xy5/Rising%20EPS%20and%20DIV.mp4?dl=0


Impressive earnings.