THE MTI HAS NOT BROKEN ABOVE 1.00.
Written by: Robert and Russell Markham
The recent surge in the market has been exactly what we have needed to restore confidence, but there has always been one nagging question: When will the Market Timing Indicator (MTI) break above 1.00?
The weekly Essay back on the 3rd of April spoke about the MTI and the four things it was designed to do:
1. Go above 1.00 prior to a Confirmed Upturn,
2. Stay above 1.00 during a Confirmed Upturn,
3. Go below 1.00 prior to a Confirmed Downturn,
4. Stay below 1.00 during a Confirmed Downturn.
The MTI is an incredibly powerful indicator. It entails both fundamental and technical analysis for the market and is put onto a scale of 0.00-2.00. Above 1.00, the Underlying Trend of the market is Up and below 1.00, the Underlying Trend of the market is Down. Although we have seen entry signals on the DEW Timing system (check out the Essay on the 17th of April) and the GLB/RT Kicker (check out the Essay on the 9th of April), our most conservative of all our Market Timing signals has not noted an entry into the market yet.
Our most conservative signal is the Confirmed Signal. The rules are as follows:
A Confirmed Up (C/Up) signal is given when both of the following occur:
1. Price- The price of the VectorVest Composite (VVC/AU) has increased five-trading-day-period over five-trading-day-period for two consecutive five-trading-day-periods. The price of the VVC/AU has increased from the prior day.
2. MTI- The Market Timing Indicator (MTI) is greater than 1.00.
A Confirmed Down (C/Dn) signal is given when both of the following occur:
1. Price- The price of the VectorVest Composite (VVC/AU) has decreased five-trading-day-period over five-trading-day-period for two consecutive five-trading-day-periods. The price of the VVC/AU has decreased from the prior day.
2. MTI- The Market Timing Indicator (MTI) is less than 1.00.
Our most conservative Timing signal is yet to give us an entry sign. If you are a conservative investor, chances are you have not entered the market yet. You are waiting for the MTI to break above 1.00 and for the C/Up signal to take place. If that is you, and that is what you have set as your trading rules, then well done! You are sticking to your plan. Do not let emotion cloud your judgement. Let VectorVest guide you as we have noted many times in the past.
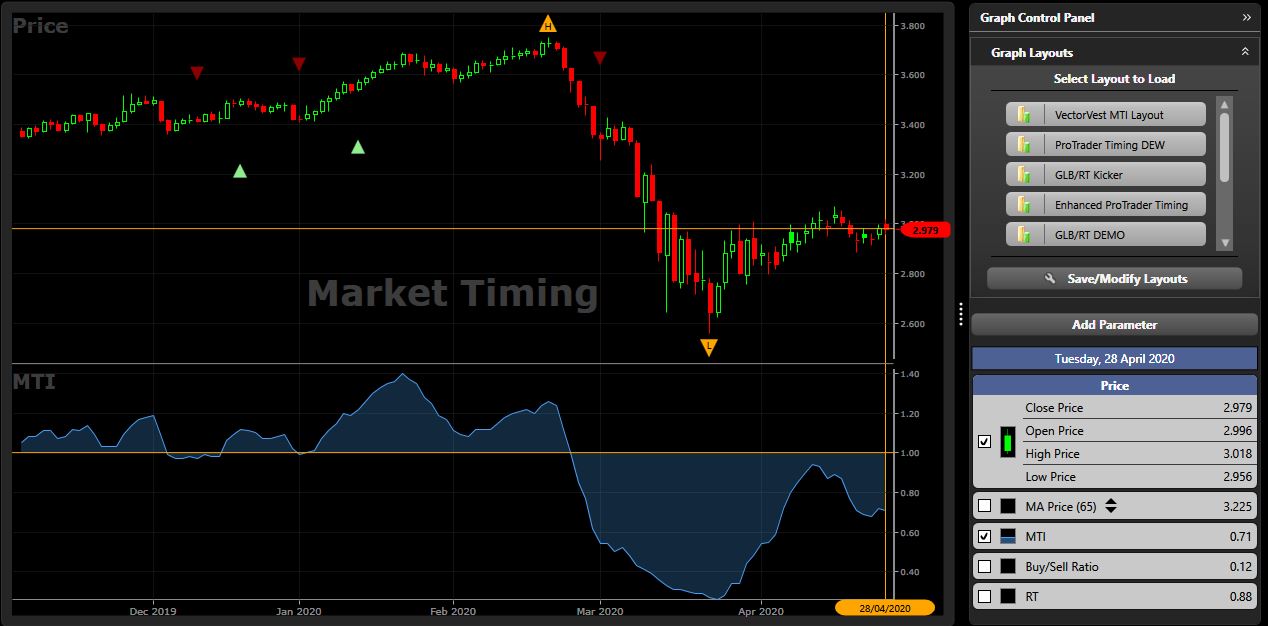
So, how far away are we from a C/Up? The best way to determine this is to open the Market Timing Graph. Click on Graphs, then in the top left corner, where it notes: Stock, click on the dropdown key to the right and select Market Timing.
Per the top right of your graph, click on Graph Layouts, click on the VectorVest MTI Layout. Notice the MTI graph, as of 21st April, the MTI is currently sitting at 0.77 and has started to develop a downtrend. A C/Up Signal requires the MTI to be above 1.00, so we will need to see the MTI break above 1.00. Until that happens, there will be no C/Up signal given.
So, when will the C/Up signal take place? We do not predict at VectorVest, rather we analyse what is in front of us. If we continue to see the MTI heading downwards, it tells me that it will most likely take longer yet before we see a C/Up. If you refer to the Essay on the 28th of December 2018, entitled “The Average Duration of the Confirmed Down Call Over the Last 5 Years,” the analysis at the time noted the average time to be 47 days for a C/Dn. By my count, as of 21st April, 51 days have elapsed. However, these are no ordinary times, it will be interesting to see how long this C/Dn plays out.
The longer this C/Dn remains in place, the more potentially explosive the rally will be…time will tell! Some of your favourite stocks are most likely at levels not seen since 2013, providing you with significant opportunities! Stay focused, keep your eye on the MTI and stick to your trading plans!
On a final note, do not miss the VectorVest Financial Freedom Summit. The Summit is all about empowering you, giving you the knowledge and tools to make money in the market. It is being held over the 19th to the 20th of May. Please click here to register for the event at NO cost to you. Per registration link, you will also see the agenda over the 3 days.
Please note, the times are given in US Eastern Time equivalent.
The 2 Australian talks are:
Tuesday, 19 May at 9am: High Net Profit Margin
Tuesday, 19 May at 10am: Gold Stocks – The Australian Experience Over the Last 12 Years
Have a look at some of the other talks from around the world; what an action-packed Summit it will be! I cannot wait to listen to these great talks!
Here is a handy link to covert the talks times from Eastern Time (US) to Australian time equivalent across our major regions:
click here


Leave A Comment