
Australia’s Rising Market
What an exciting time to be in the market as it continues to power higher! To check out how the market is performing, use VectorVest’s powerful Market Timing Graph functionality.
Click on the Timing tab on the main toolbar and then click on the Market Timing Graph. This will open the Market Timing graph in a separate window. Navigate to Graph Layouts in the top right corner and select the VectorVest MTI Layout. This will load up the VVC/AU candlestick graph (the arithmetic-indexed average of all the stocks we track) along with Relative Timing (RT) and Market Timing Indicator (MTI). In addition, the layout will also consist of the Buy/Sell Ratio (BSR). Notice how MTI held above 1.00 since 9 October 2017 and the BSR has also broken above 1.00 (meaning there are more Buy rated stocks to Sell rated stocks as of 4 January 2018). Note how RT has broken above 1.00 on 1 August 2017 and has continued to power up. These are bullish signs!

Click or tap image to enlarge.
At the bottom of the graph, look for the Last Close button in yellow on the bottom left. Click on the dropdown arrow to the left of this button which reveals all the different market timing signals in VectorVest and select: Confirmed Calls. The Confirmed Calls Market Timing signal is the most conservative of all the market timing signals in VectorVest. To get a Confirmed Up (C/Up) signal, the Price of the VVC/AU has increased for two consecutive five-day trading periods and the MTI must be above 1.00. Notice how the last confirmed call was on 9 October 2017. The market has been running strong since that time, with us still in a C/Up!
How can we look to benefit from the market using the top rated fundamental and technical stocks in VectorVest?
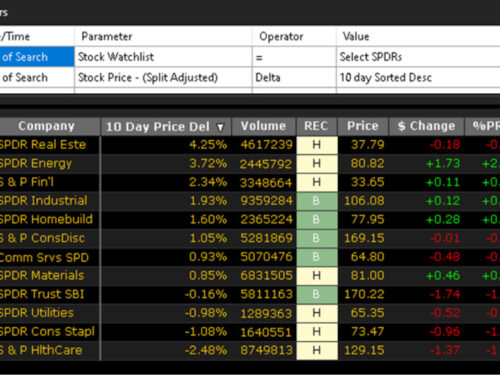
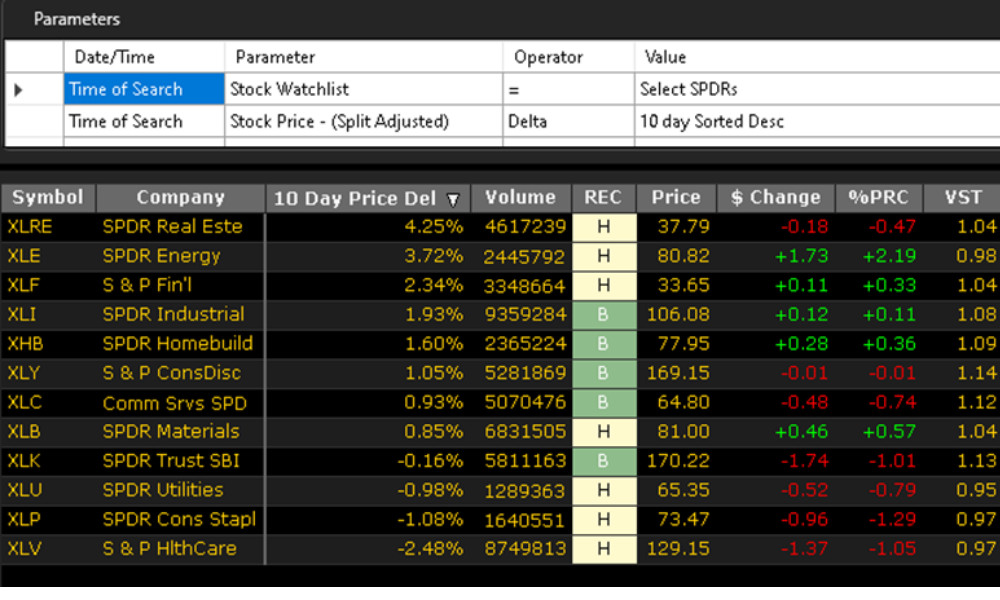
Close out of this window and select the Viewers tab and click on Stock Viewer. This will list all the stocks we track in VectorVest and these stocks are, by default, sorted by VST. To ensure your stocks are sorted by VST, click on the VST heading until your stocks are sorted by VST in descending order. VST is our master indicator. It stands for Value, Safety and Timing. It finds the best combination of fundamental and technical signs. Set the date to our last C/Up on 9 October 2017 by clicking on the date box (just above the heading Company in Stock Viewer) and changing the date accordingly and then press OK. Look for the QuickTest button at the top of screen and click on the dropdown button. Change the parameters such that you are testing the top ten and click QuickTest Top 10. This will QuickTest the top 10 stocks from 9 October 2017 to 9 January 2018. As of this date, the Top 10 produced 24.89%! The market went up 8.45% in that period (as noted per the VVC/AU line below). Notice some explosive returns in that list!

Click or tap image to enlarge
This time, click on the dropdown arrow to the right of QuickTest and select the top 20 stocks and run the test again. The top 20 from 9 October 2017 to 9 January 2018 had returns of 25.34%! Only 3 losers out of 20 stocks! One last set of analysis should you wish, this time, change your sort to RT*CI (to see the instructions and rational behind such a sort, please refer to the 17 of November 2017 essay). QuickTest the Top 10 using the RT*CI sort from 9 October 2017 to 9 January 2018: 39.52%! Now test the Top 20: 28.28%. Wow!

Click or tap image to enlarge.
The key here is that we need to be aware of market timing. In a market running in a strong upward trend, finding top fundamental and technical stocks is easy with VectorVest!
Written by: Robert and Russell Markham


Leave A Comment