
Market Direction is Key
Market direction is the key to making money in any market. “Being on the wrong side of the market is the worst thing that can happen to an investor. It doesn’t have to happen to you” (p 70 “Stocks, Strategies and Common Sense,” Dr. Bart DiLiddo).
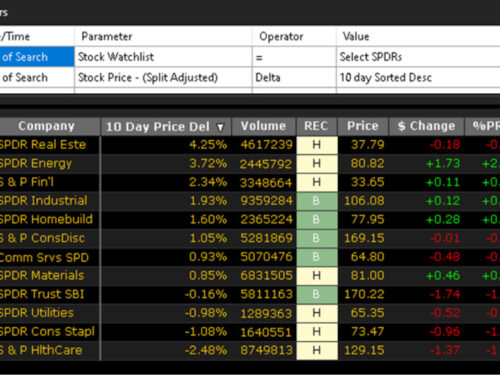
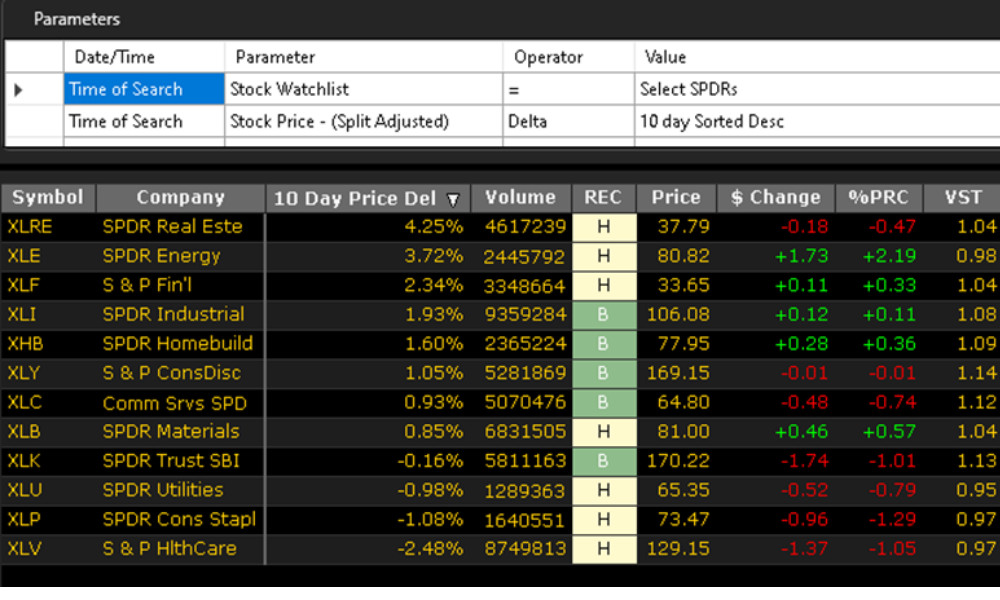
Last week we showed you how to take advantage of the rising Australian Share Market which has been powering on over the last three-and-a-half months.
The question is how much higher can it go? We have differing predictions from a number of local market commentators, ranging from optimism to an impending crash. At VectorVest we don’t predict what the market will do, but we do have the tools to help us stay on the right side of the market.
Two Powerful Tools to Track Market Direction
Let’s talk about two powerful tools that can be used together. The first considers the longer-term market outlook based on whether we are in a Bull or Bear Market Scenario and the second looks at the short-term market movements within a particular Scenario.
According to our 1st tool, the VectorVest Market Climate, Australia has been in an uninterrupted Bull market since September 2016 (the USA market for longer). We are currently in a Case 4, Bull Market Scenario with earnings, inflation and interest rates rising. Refer to Dr. DiLiddo’s essay on March 21, 2003, called “The Truth Chart” in VectorVest US, which shows how we define the various Bull and Bear Market Scenarios. We can track where we are every Friday by going to the Views tab on the main toolbar and then to the Climate Section. To see the trend in the key indicators of earnings, interest rates and inflation, go to the Graphs tab on the main toolbar, click on the dropdown arrow to the right of Stock and select Market Climate. Ensure the AORD Index, AORD Earnings, T-Notes and CPI parameters are ticked. Rising earnings are necessary for all 4 Bull Market Scenarios. All 4 Bear Market Scenarios have falling earnings, so earnings are the key. An early indicator of a possible change from Bull to Bear Market conditions will be rising, high inflation. This generally causes the authorities to raise interest rates, which, in turn, impact negatively on company earnings. The current market is nowhere near that scenario right now, but we will track it week-by-week and keep you informed of where we are.

Click or tap image to enlarge
This brings us to our 2nd tool, the VectorVest Market Timing System, which, when used with the 1st, helps us stay on the right side of the market. Markets move in cycles, and even Bull Markets have corrections, go sideways and have rallies. Go to the Graphs tab again and select Market Timing, ensuring the Price and MTI boxes are ticked. If you look at a 5 or 10-year graph, you will see that in Australia, when the MTI rises to between 1.3 and 1.4 (indicating the market is getting “toppy”), it is generally followed by a pullback. This is a time to be more defensive, and you don’t want to buy shares when the market is due for a correction. Rather add stocks when the MTI starts moving up again after a pullback, ensuring, of course, that we are in a Confirmed Up, C/Up, and that there is a green light in the Price column of the Color Guard.

Click or tap image to enlarge.
Finally, whatever Scenario we are in, if you are invested in the market, always protect your capital with appropriate money/risk management tools such as stop-losses.
Written by: Robert Markham
Want to always be on the right side of the market? Try VectorVest today!


Leave A Comment