
WHAT NOT TO LOOK FOR IN A STOCK.
Written by: Robert and Russell Markham
Over the last few weeks we have looked at some wonderful stocks with smooth left to right price patterns and smooth left to right earnings profiles. These stocks have demonstrated strong fundamental and technical parameters as identified by the VST Score. The VST Score is on a scale of 0.00 – 2.00 and incorporates Relative Value (RV), Relative Safety (RS) and Relative Timing (RT).
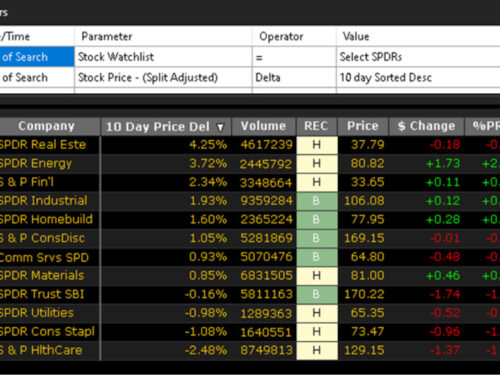
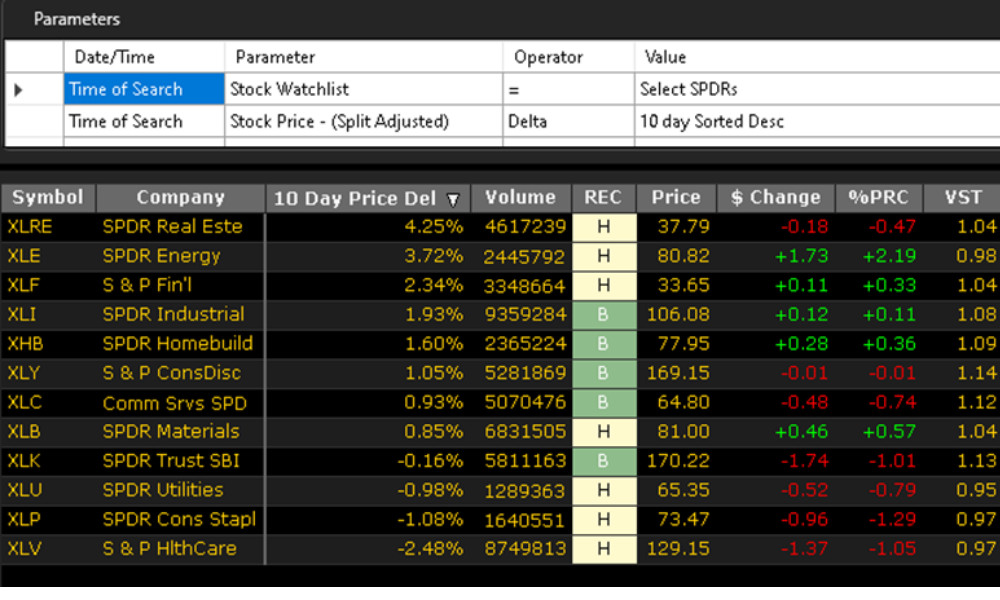
To demonstrate what not to look for, I am going to pick on the ASX200 list. Locate this WatchList under the Viewers tab and then locate the group: S&P/ASX. Open this group and select S&P/ASX 200. This will now open the ASX200 list. All the stocks will be sorted by VST by default. Click on the VST column and sort it such that the list is sorted by VST in ascending order. As of 26 June, the first 4 stocks for me are: RFG.AX, AHG.AX, AST.AX and TLS.AX.
Let’s look at the VST of the first 4 stocks. All the scores are well below 1.00 (on a scale of 0.00 to 2.00). This tells me that the combination of fundamentals and technicals for these stocks is weak. None of these stocks have a strong RS either, which tells us that the consistency and predictability of the given company’s financial performance is not that strong at present. In addition, three of these companies are overvalued. In some cases, significantly overvalued. If you held these four companies at the start of the year, you would be down 36% since the start of the year. If you are into shorting stocks, this could have been a very lucrative set of stocks to short.
Let’s highlight and graph these four stocks. After highlighting the stocks, click on the dropdown arrow next the Graph button and click on Graph Selected. Setup the graph such that you are looking at share Price, EPS and RT on the graph and no other signals.
RFG.AX has declining earnings and notice how RT broke below 1.00 on 11th December and has not crossed above 1.00 since. Notice the continual decline in EPS! The next stock AHG.AX has had a falling EPS since mid-December 2016 and the decline has not stopped yet. The RT currently is in a strong downtrend. AST.AX has held up well relative to the other stocks, but notice how earning continues to fall and has been falling since December 2016. Despite being the better of the 4 stocks, it is still down over 12% since the start of the year.
The last stock is TLS.AX. Many investors have held or hold this stock. It has traditionally been bought and held for its dividends. Ask yourself this question “If I hold onto a stock with falling earnings and a low RS score, do I think dividends will hold up?” It almost becomes a rhetorical question. If you look at the Dividend Safety (DS) (on a scale of 0 to 99), we can see that the DS score is currently at 35. This tells us that is very unlikely that the dividend of 9.96% on offer will be met. The graph has shown a textbook smooth from left to right decline in Price along with a consistently falling set of EPS. The EPS has been falling since August 2016 and with a GRT of -5%, it is unlikely for now to see those earnings turning around.
So next time you are looking to buy stocks, do the exact opposite to what has been noted. Find those smooth left to right upward trending stocks that are undervalued. Find those smooth rising EPS and find those stocks with a solid VST score. For your ASX 200 list, re-sort by VST this time in descending order. The top 4 stocks I now get are A2M.AX, WHC.AX, SAR.AX and ALL.AX (I skipped WTC.AX since it was overvalued). These 4 stocks have returned over 29% since the start of the year!
DISCLAIMER: THE ABOVE ARTICLE DOES NOT CONSTITUTE FINANCIAL ADVICE. PAST PERFORMANCE IS NOT INDICATIVE OF FUTURE RESULTS. YOU SHOULD CONSULT WITH YOUR LEGAL, TAX, FINANCIAL, AND OTHER ADVISERS PRIOR TO MAKING ANY INVESTMENT.


Leave A Comment